
WHAT'S NEW
See what’s new with Webex Experience Management and take a look at recent history of larger product updates.
Interested in knowing what’s in our kitchen and coming soon? Visit Early Preview to learn about things that are slated to be released soon.
Last Updated on Jan 24, 2022
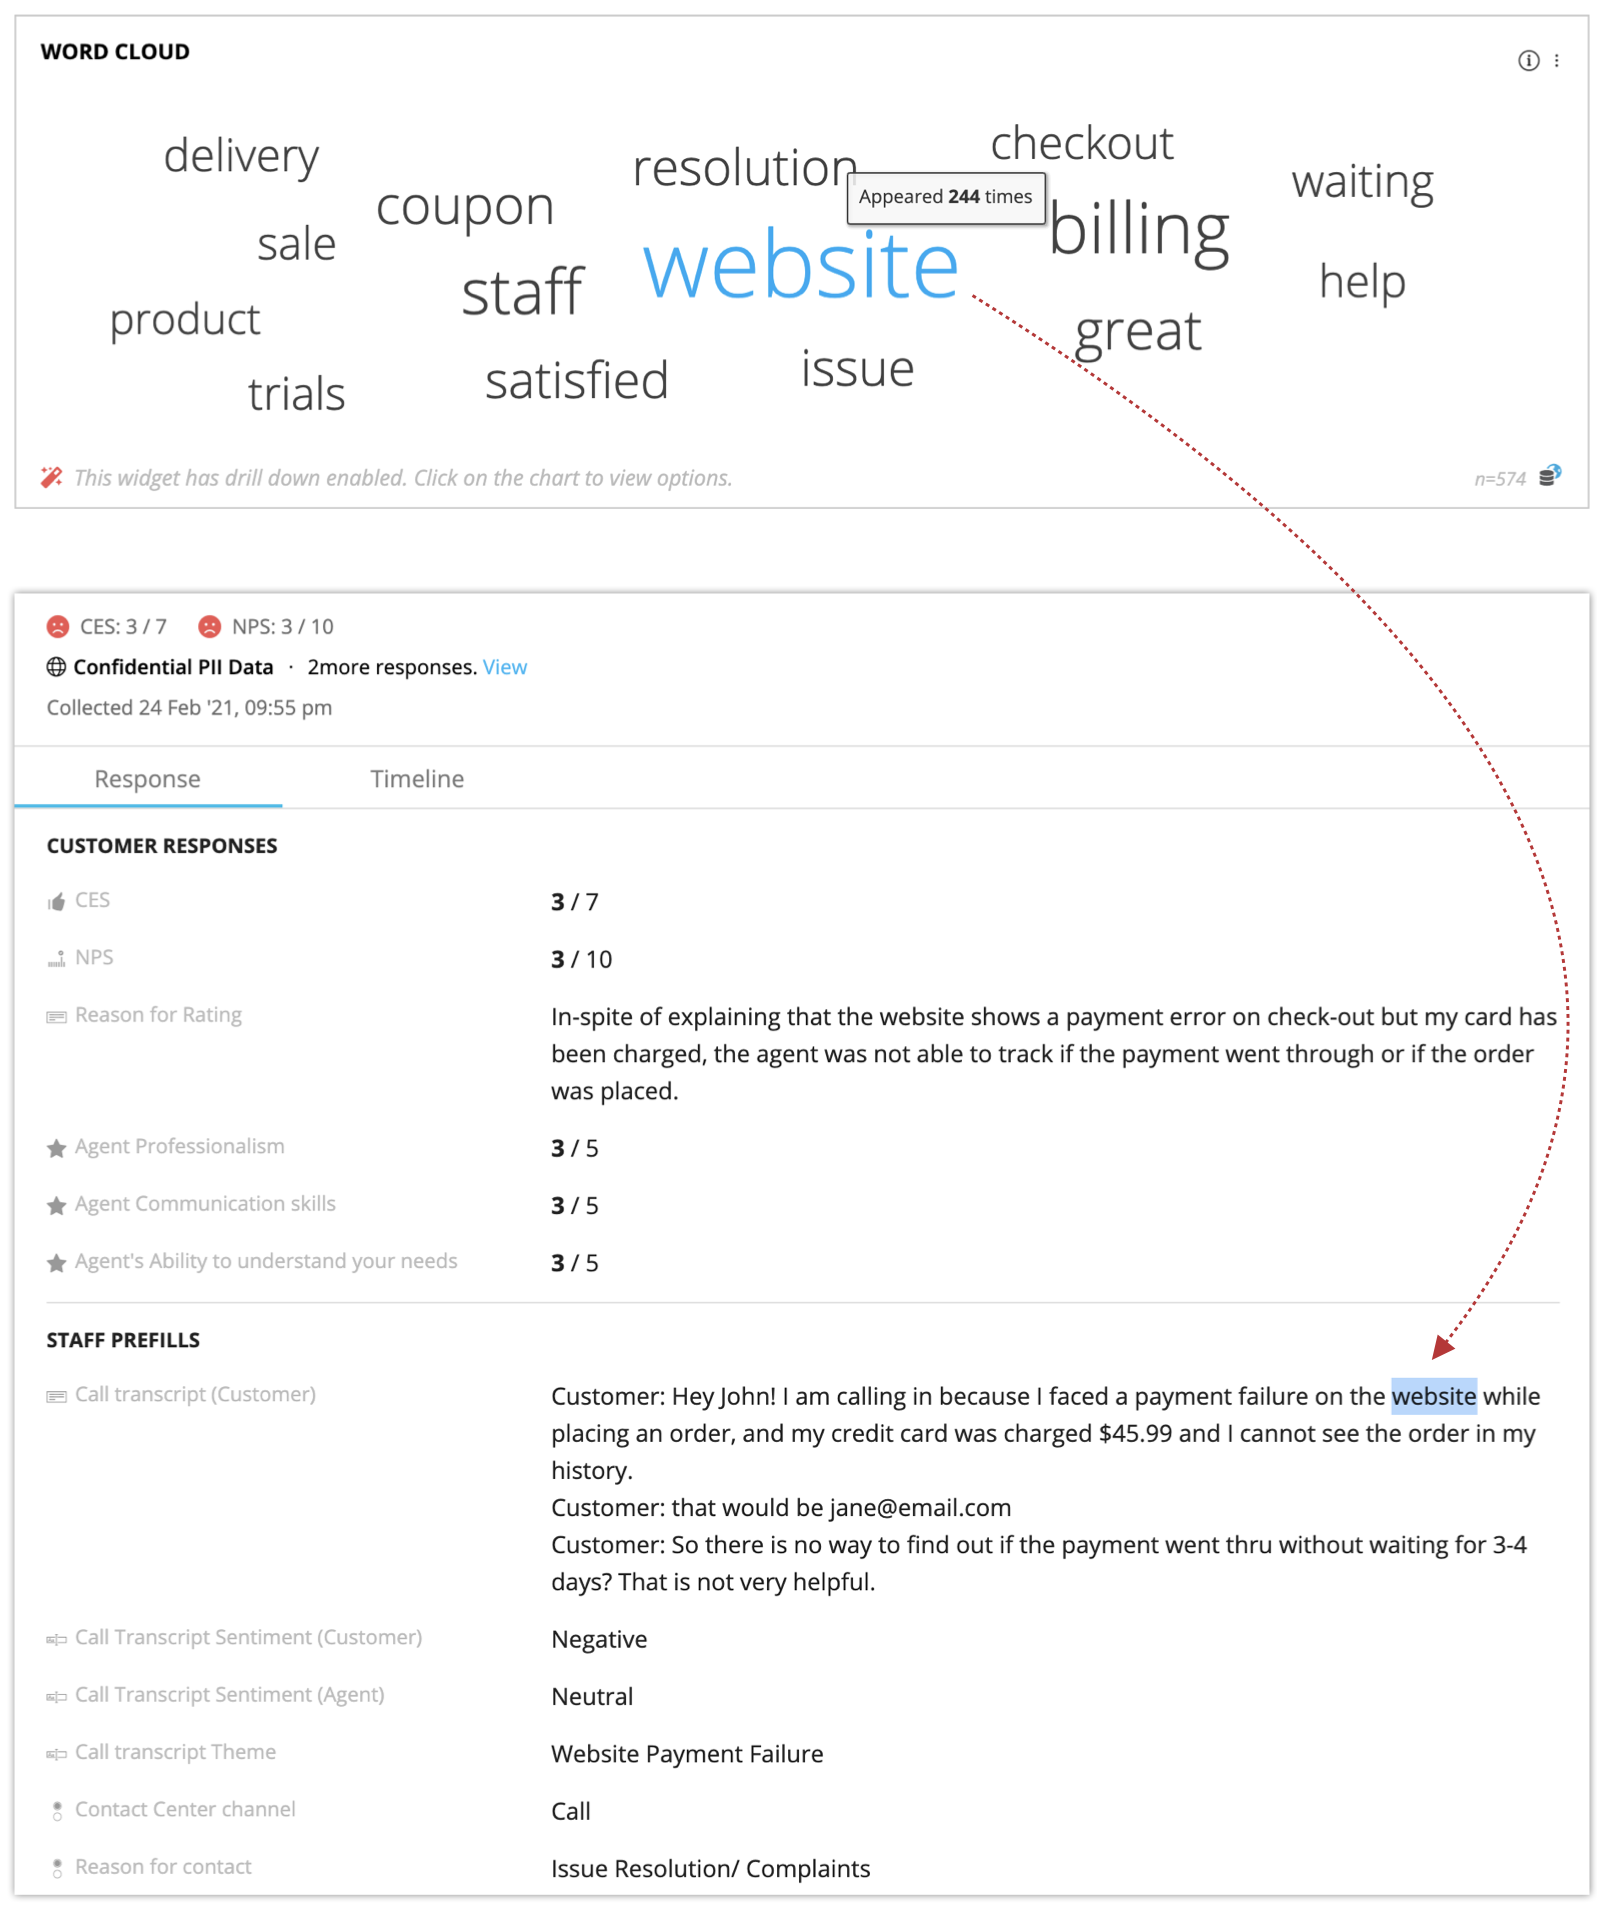
- Recorded call transcripts powered by Cisco AI come together with the powerful text and sentiment analysis in Experience Management. This empowers agents using Experience Management to understand the pulse of the customer by viewing experiential data combined with the caller’s sentiment.
- Speech diarization allows separate analysis for customer and agent conversation allowing both agents and supervisors to understand and identify patterns in call conversations.
- Word Cloud in Experience Management allows quick and easy analysis of transcript data and also enables quick drill down into individual responses from customers for further deep-dive analysis.
- We revamped the integrations module to align better with permissions and to provide an enhanced user experience.
- A new card-based layout solves both security, and usability issues and provides clarity to the user about which integration they are updating. Additionally, this layout ensures that changes made by users are not lost when they switched tabs in the older layout.
- Now sub-users can view & edit only custom SMTP, custom SMS, and invitation queue for their accounts. All other integrations are managed by the account admin.

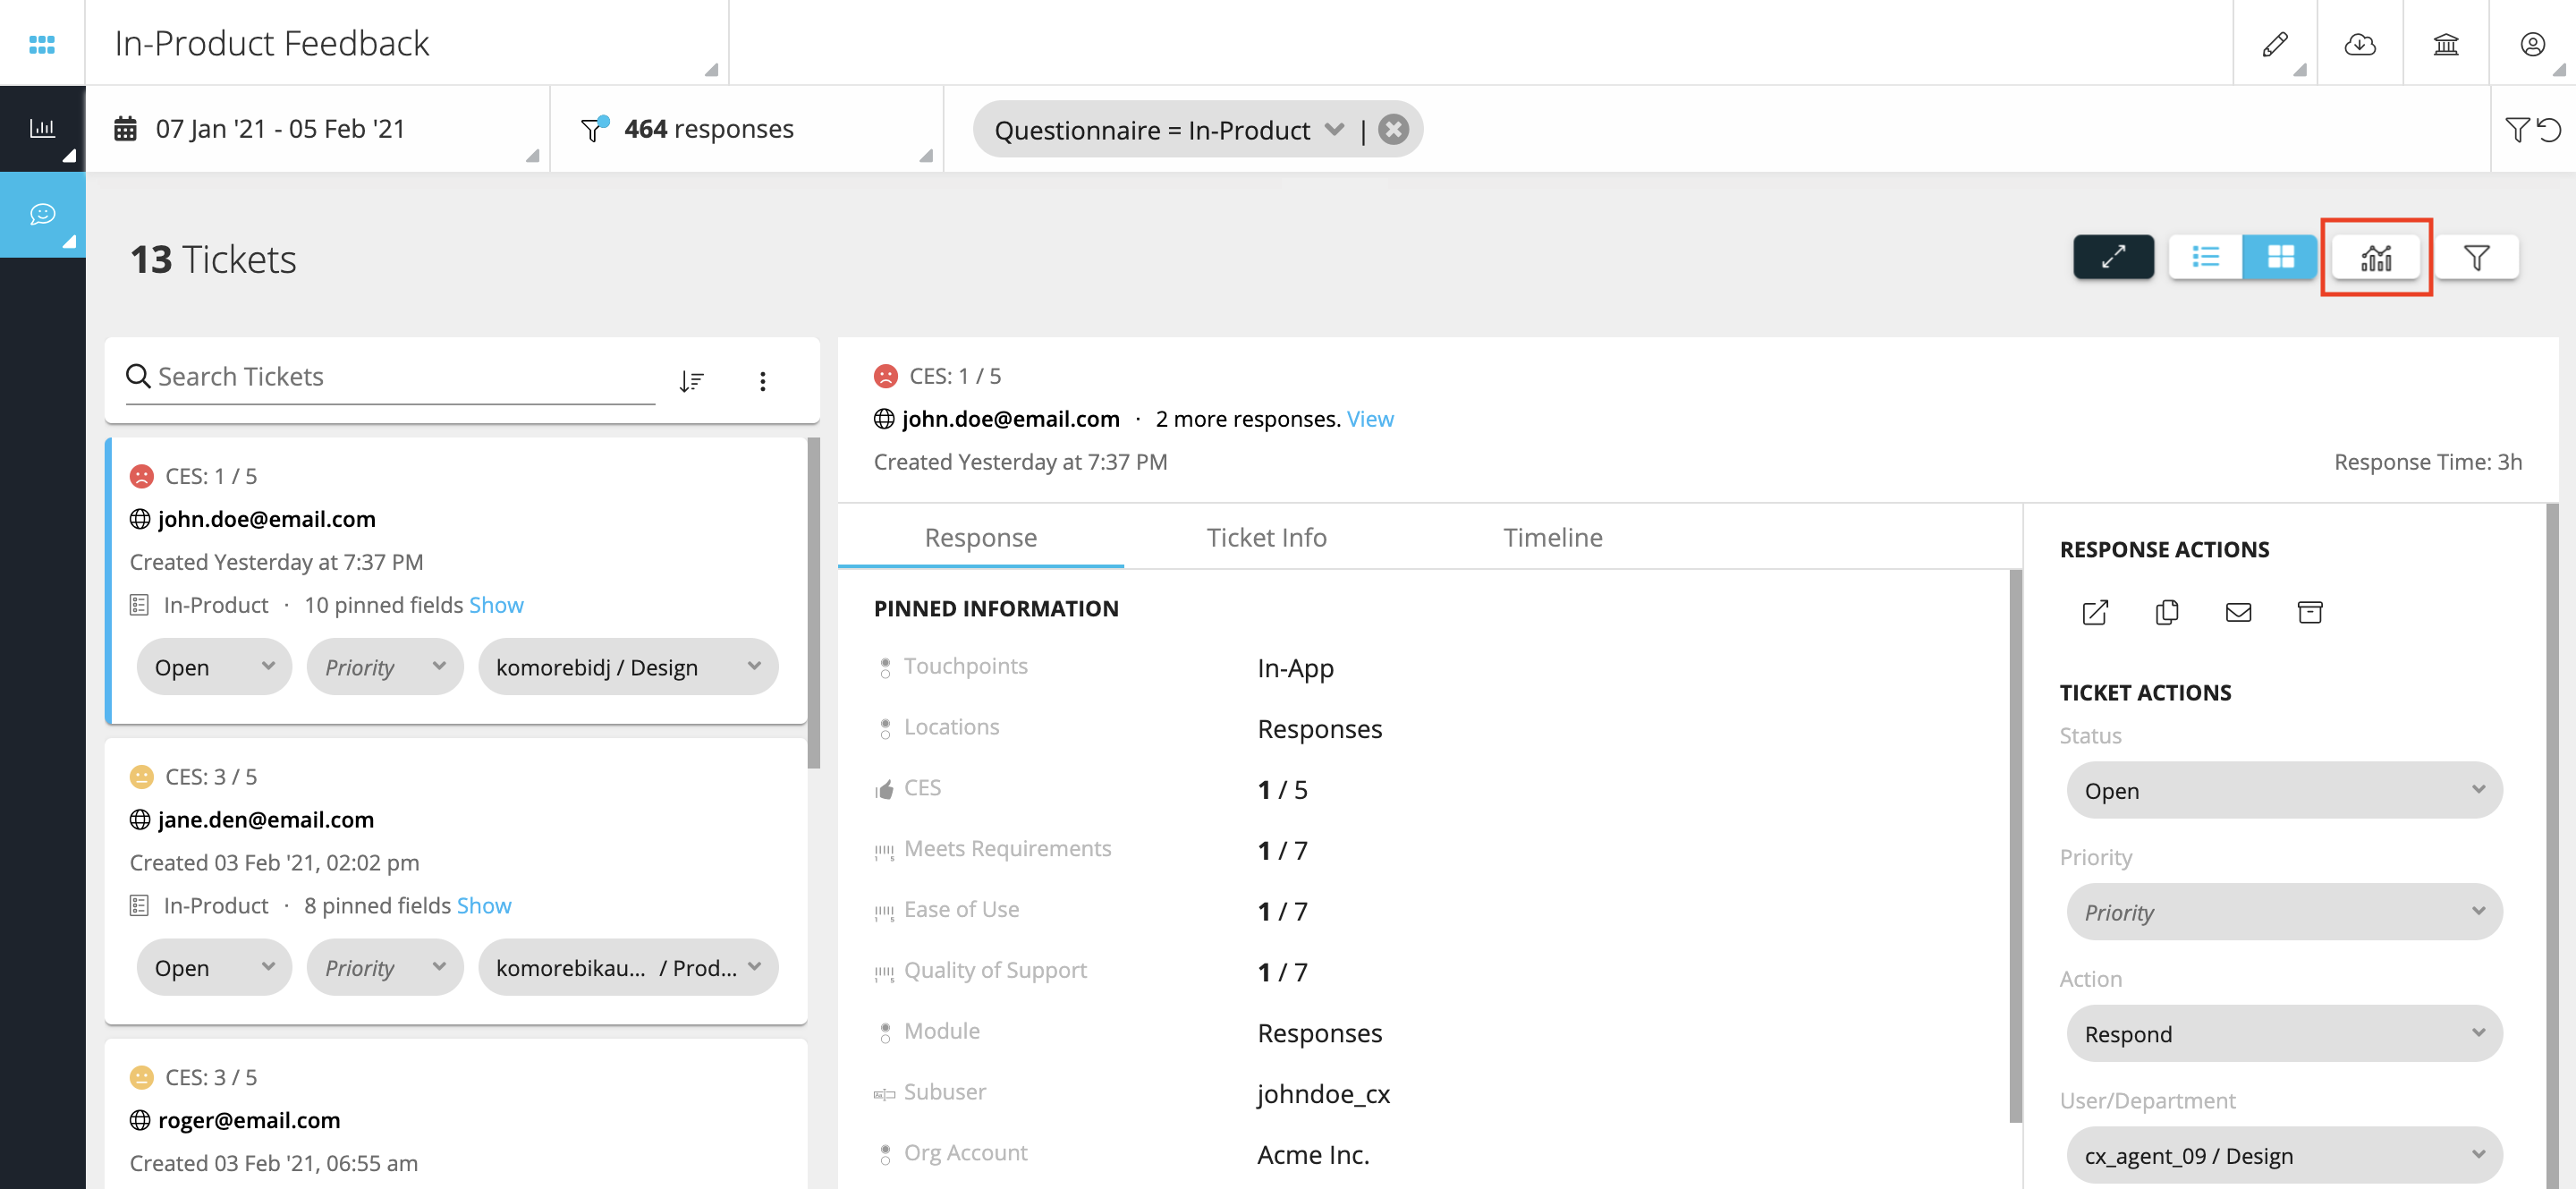
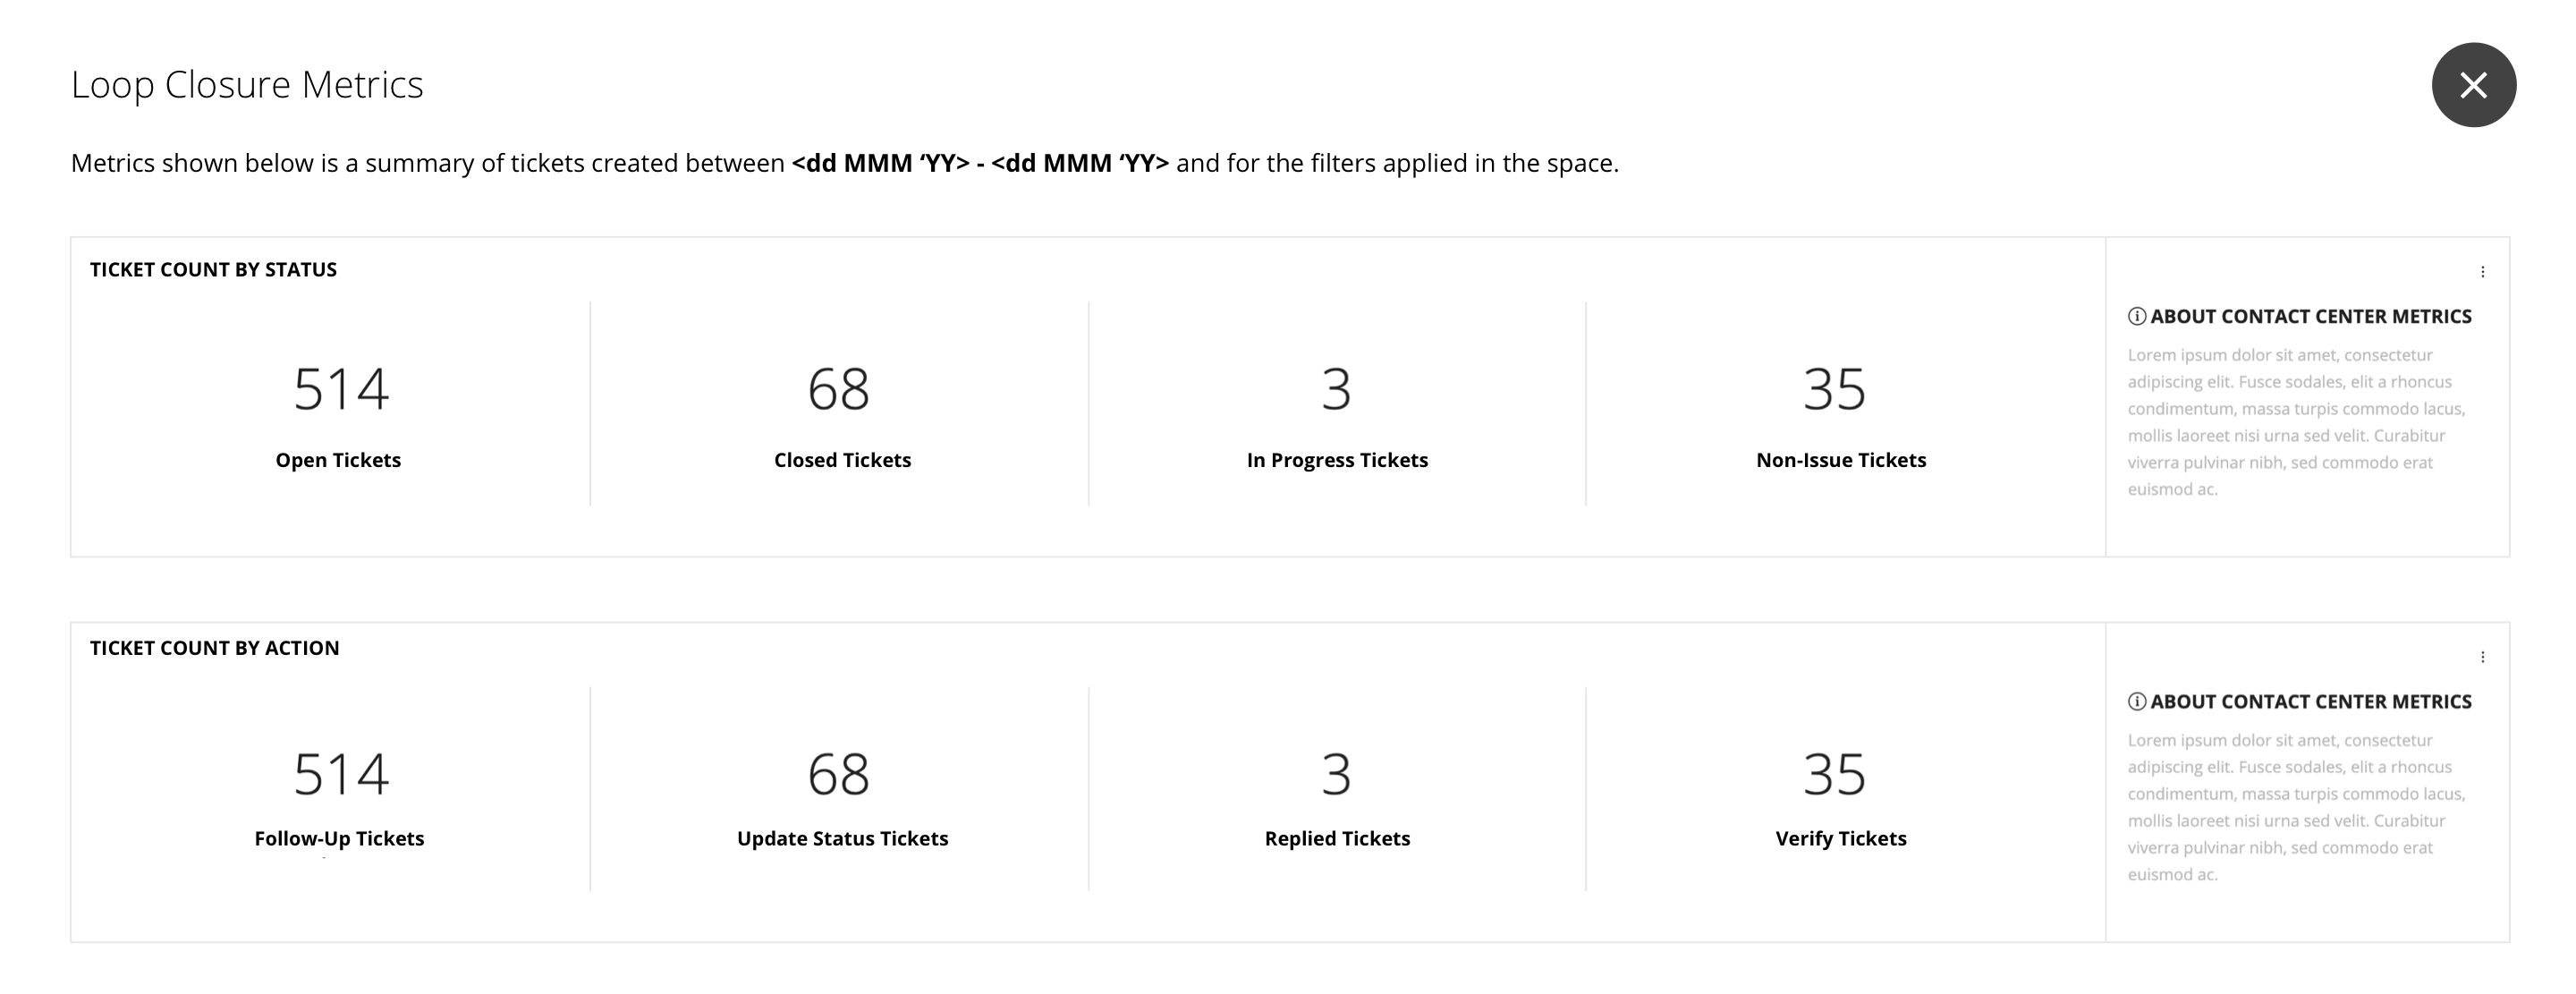
- Agents and frontline employees on loop closure can now get an aggregate summary of their tickets. A quick glance to understand open tickets, escalated, AHT, etc.
- Ticket status summary will also be available on mobile apps loop closure module for agents and frontline employees on the move removing dependency on Excel reports for a basic summary
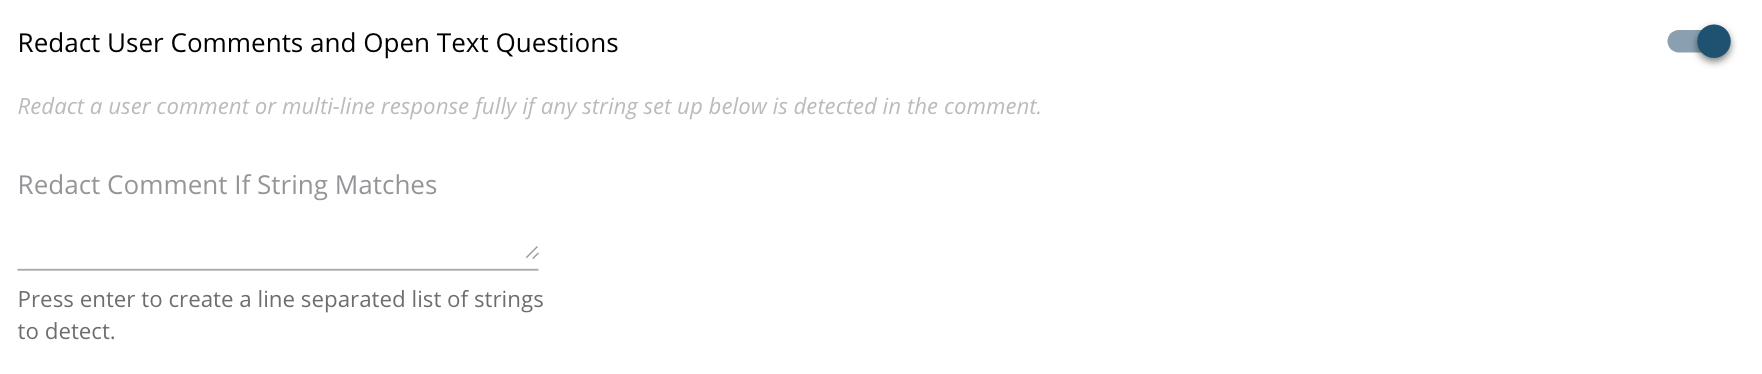
- Redact user comments on finding keywords from a configurable list to prevent exposure of sensitive information customer may have provided.
- Identify and redact emails and numbers from user comments.
- Hide themes from Theme widgets on keyword matches. This is useful to remove industry-specific words that are frequent but not insightful.
- Now quickly reorder all the Spaces based on your preference.
- Visual indication to quickly identify new Spaces assigned to you.
- Pinning for Spaces is deprecated as the new capability provides far more flexibility.

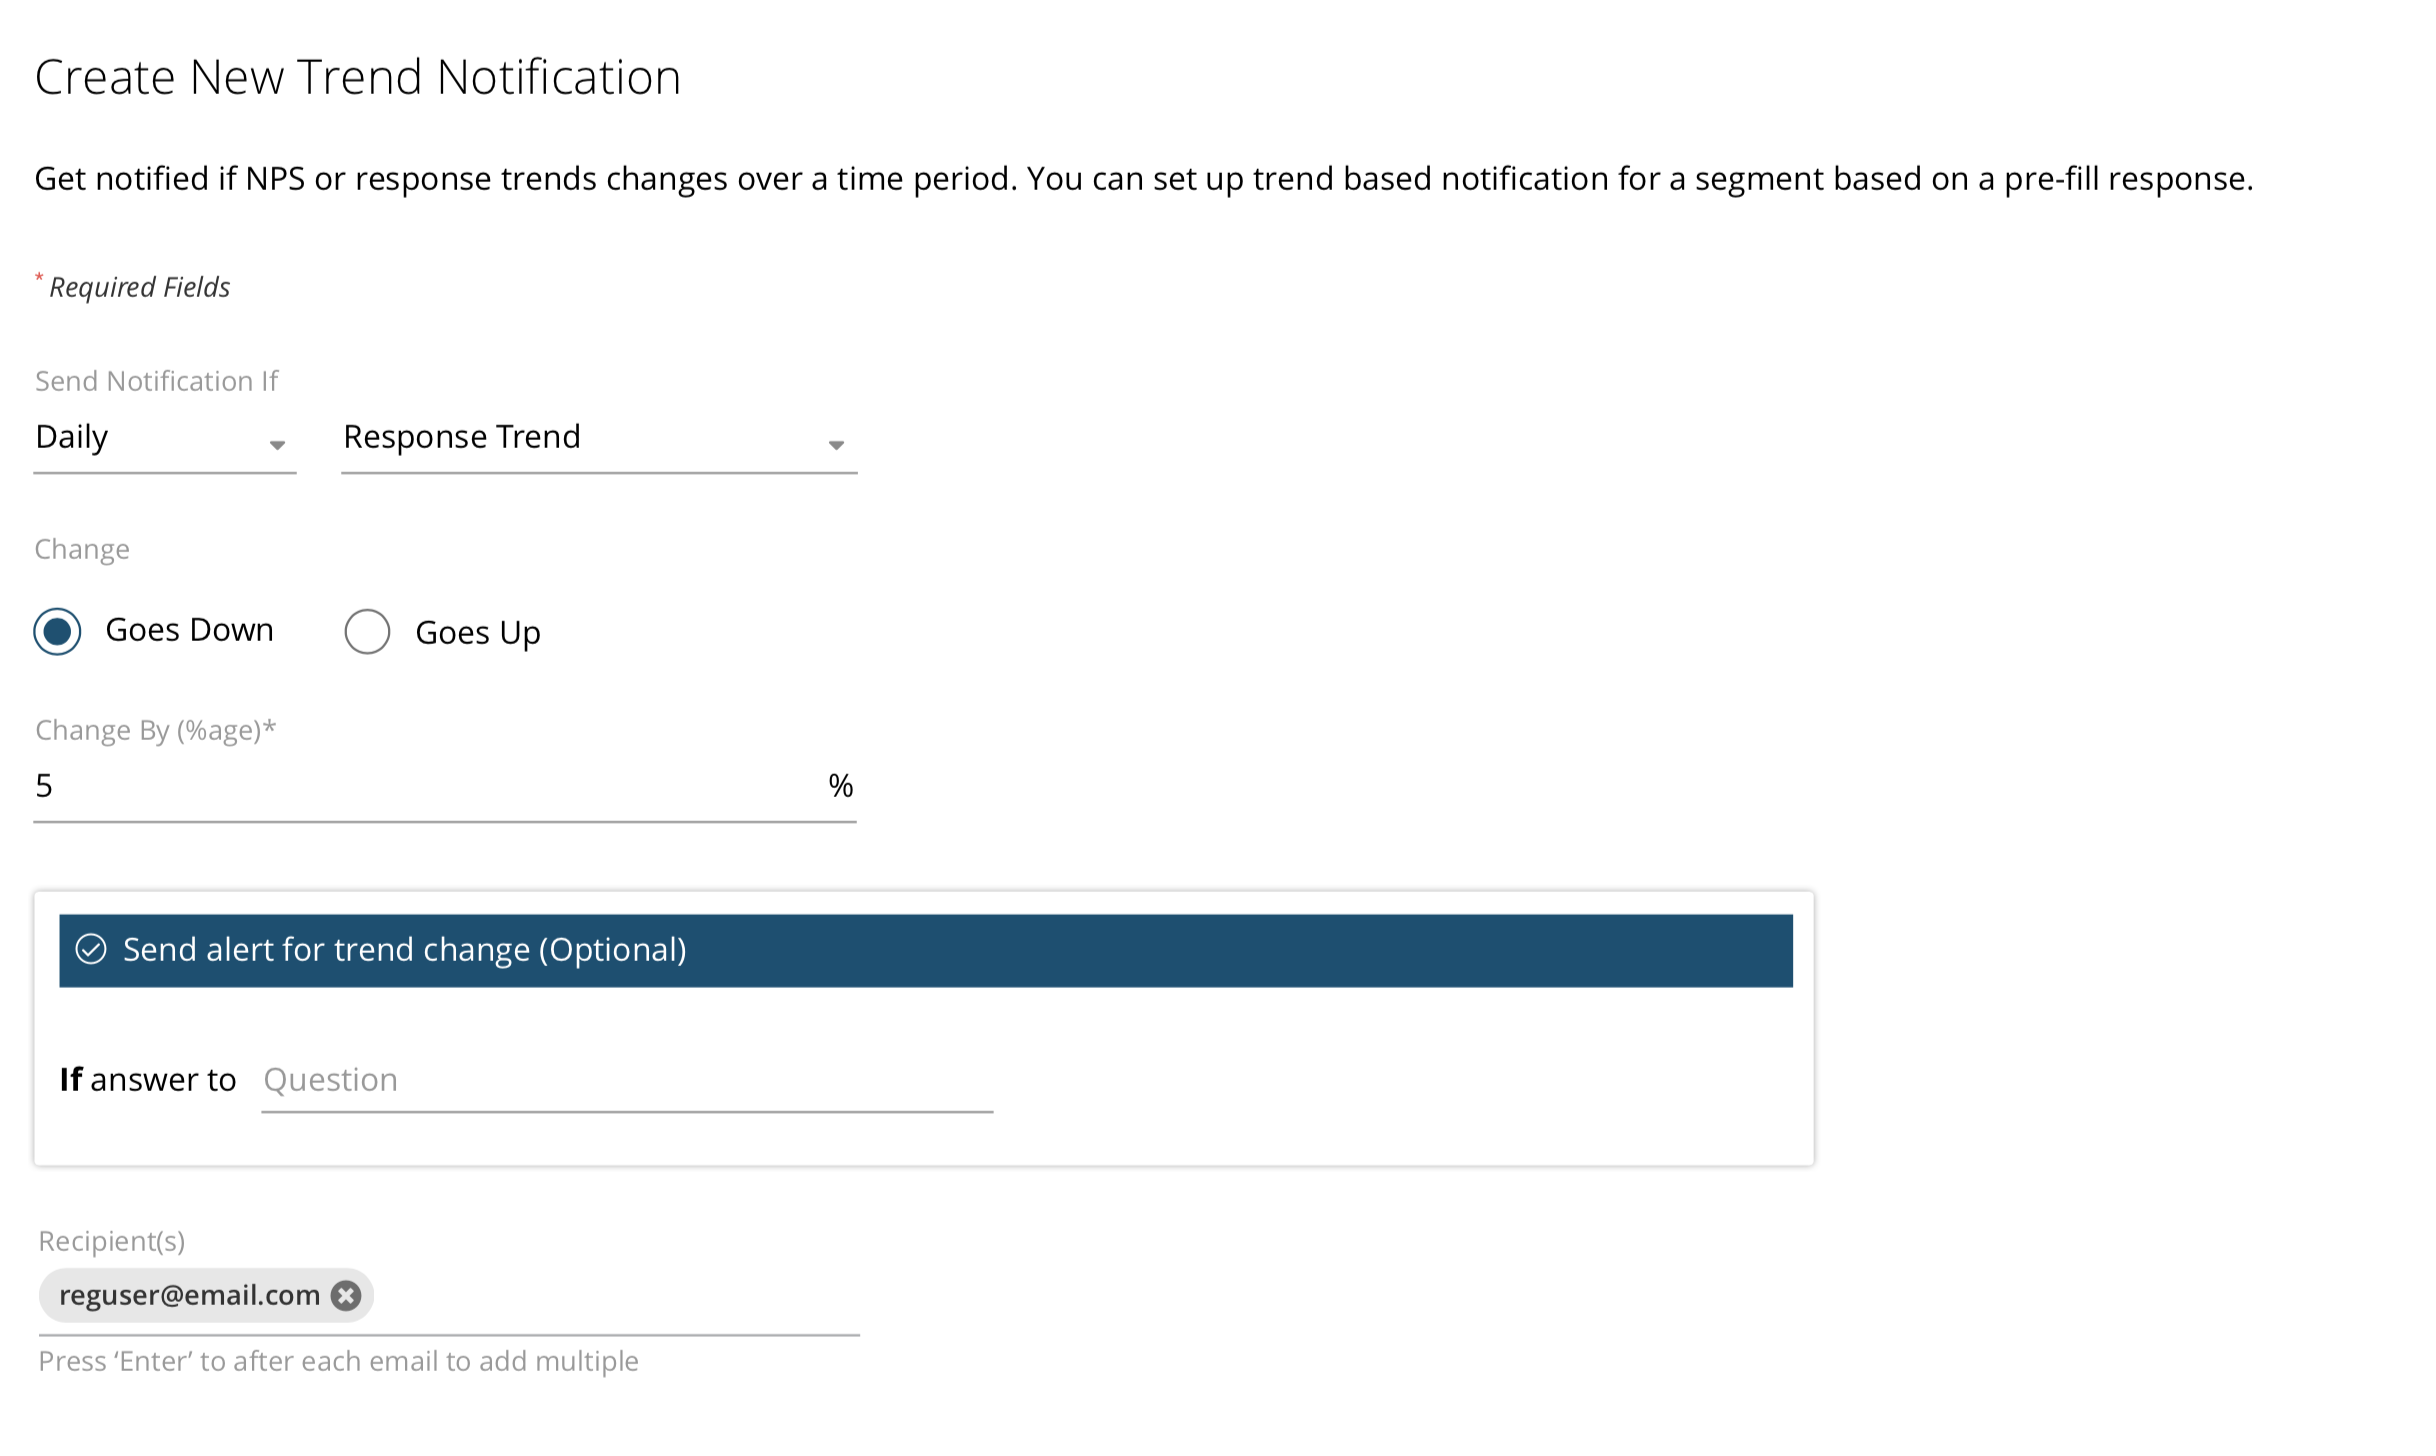
- Look beyond overall trend notification of your metric by applying segments to conditions.
- Create very targeted trend alerts for specific accounts, regions, themes, etc. and alert respective stakeholders.
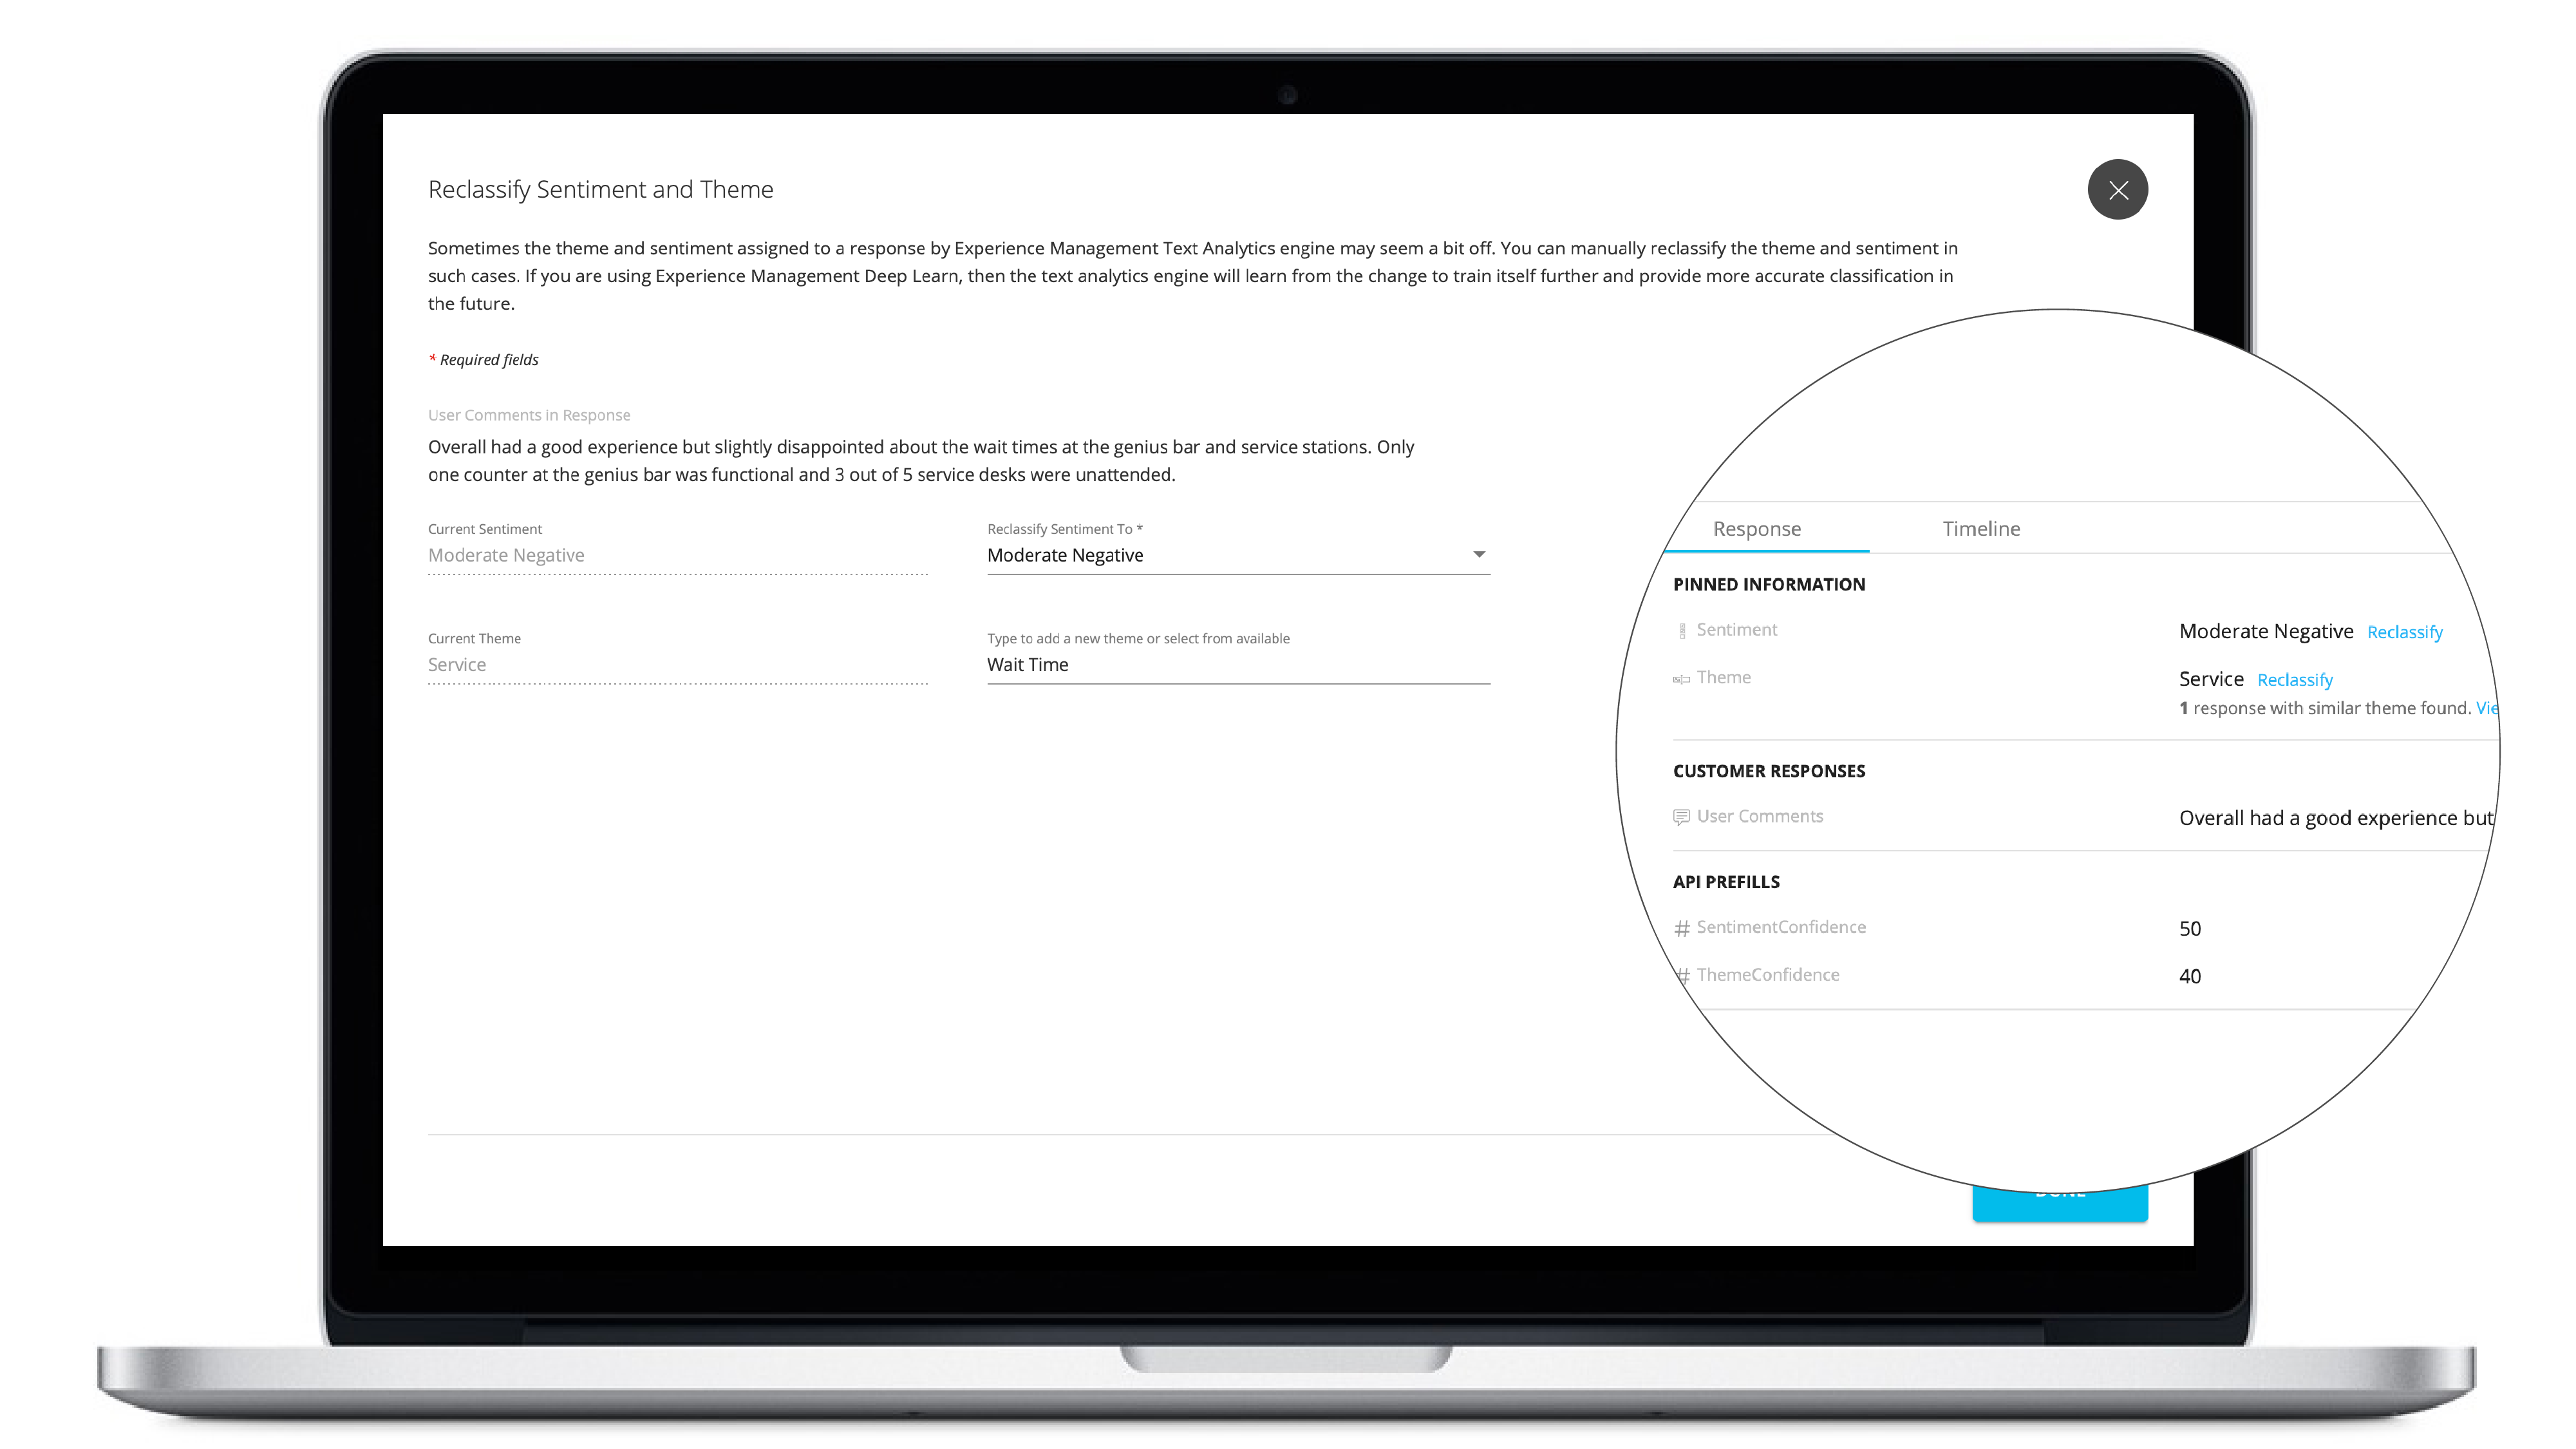
- Now improve the accuracy of deep-learn models by manually reclassifying Themes and Sentiment.
- This also updates the Themes and Sentiment which could have been classified with low confidence.
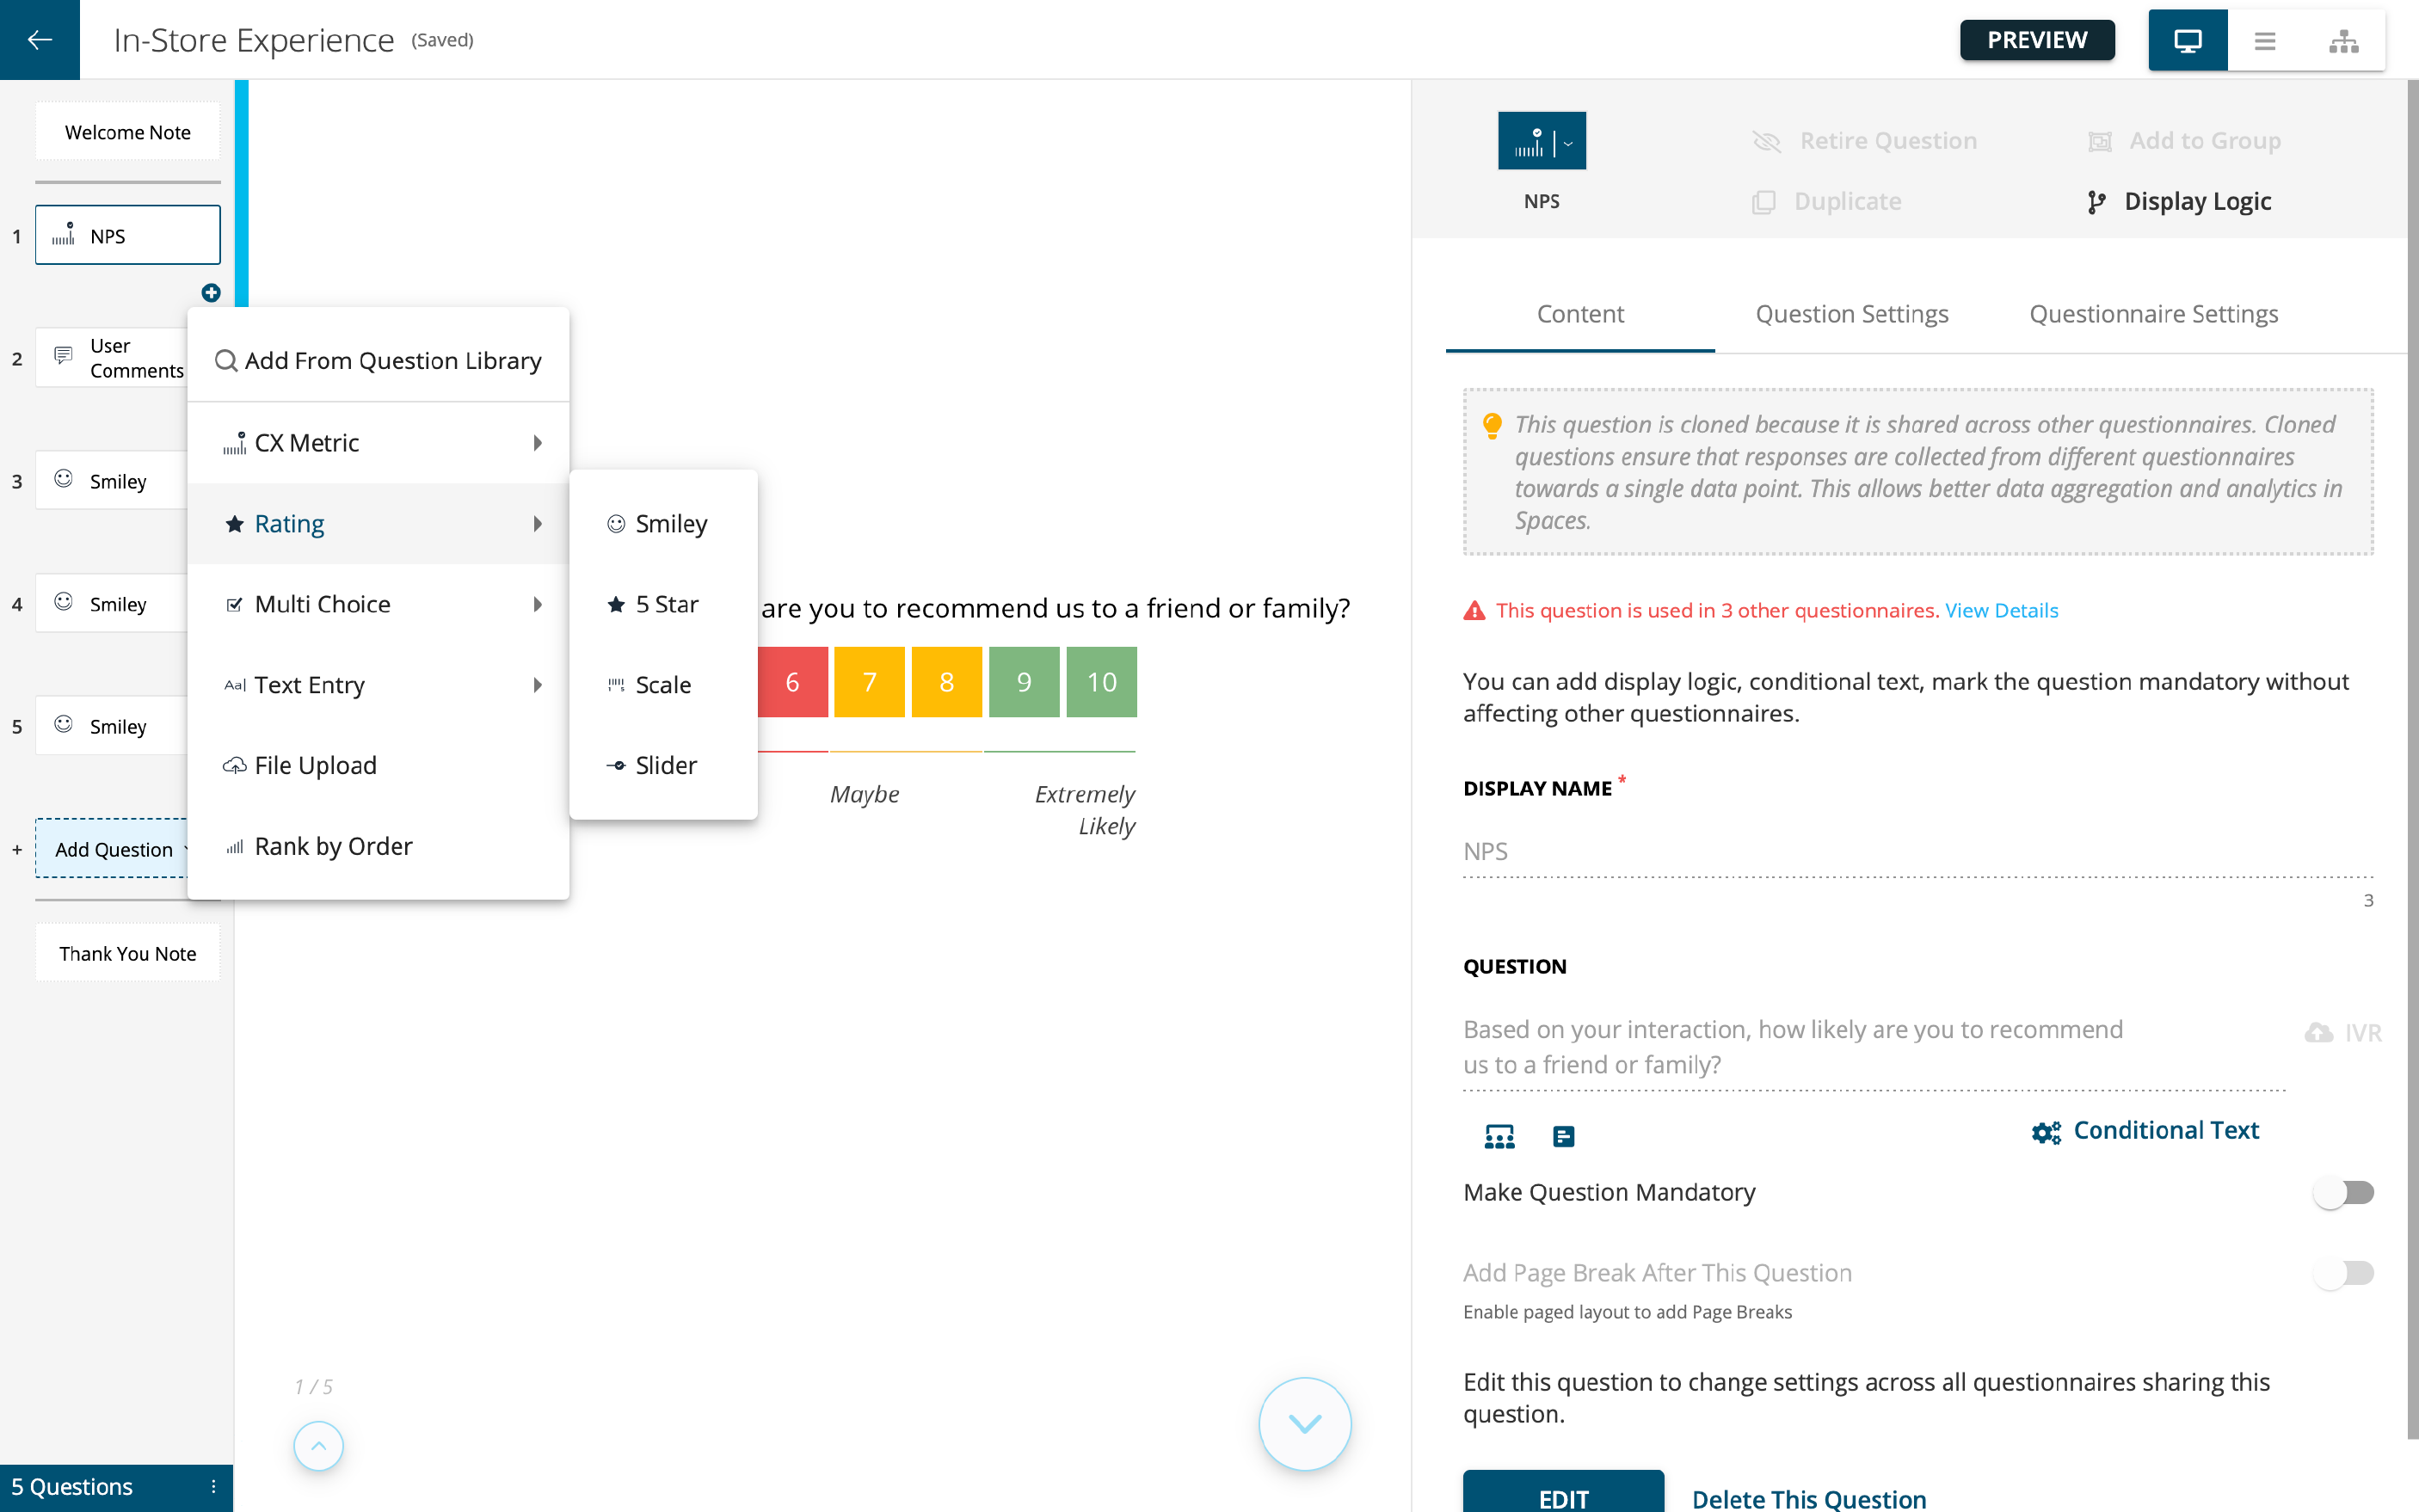
- Insert a question anywhere in the questionnaire without the need for tedious drag and drop.
- Guardrails to prevent human error by exposing dependency and usage in conditional text, display logic, etc.
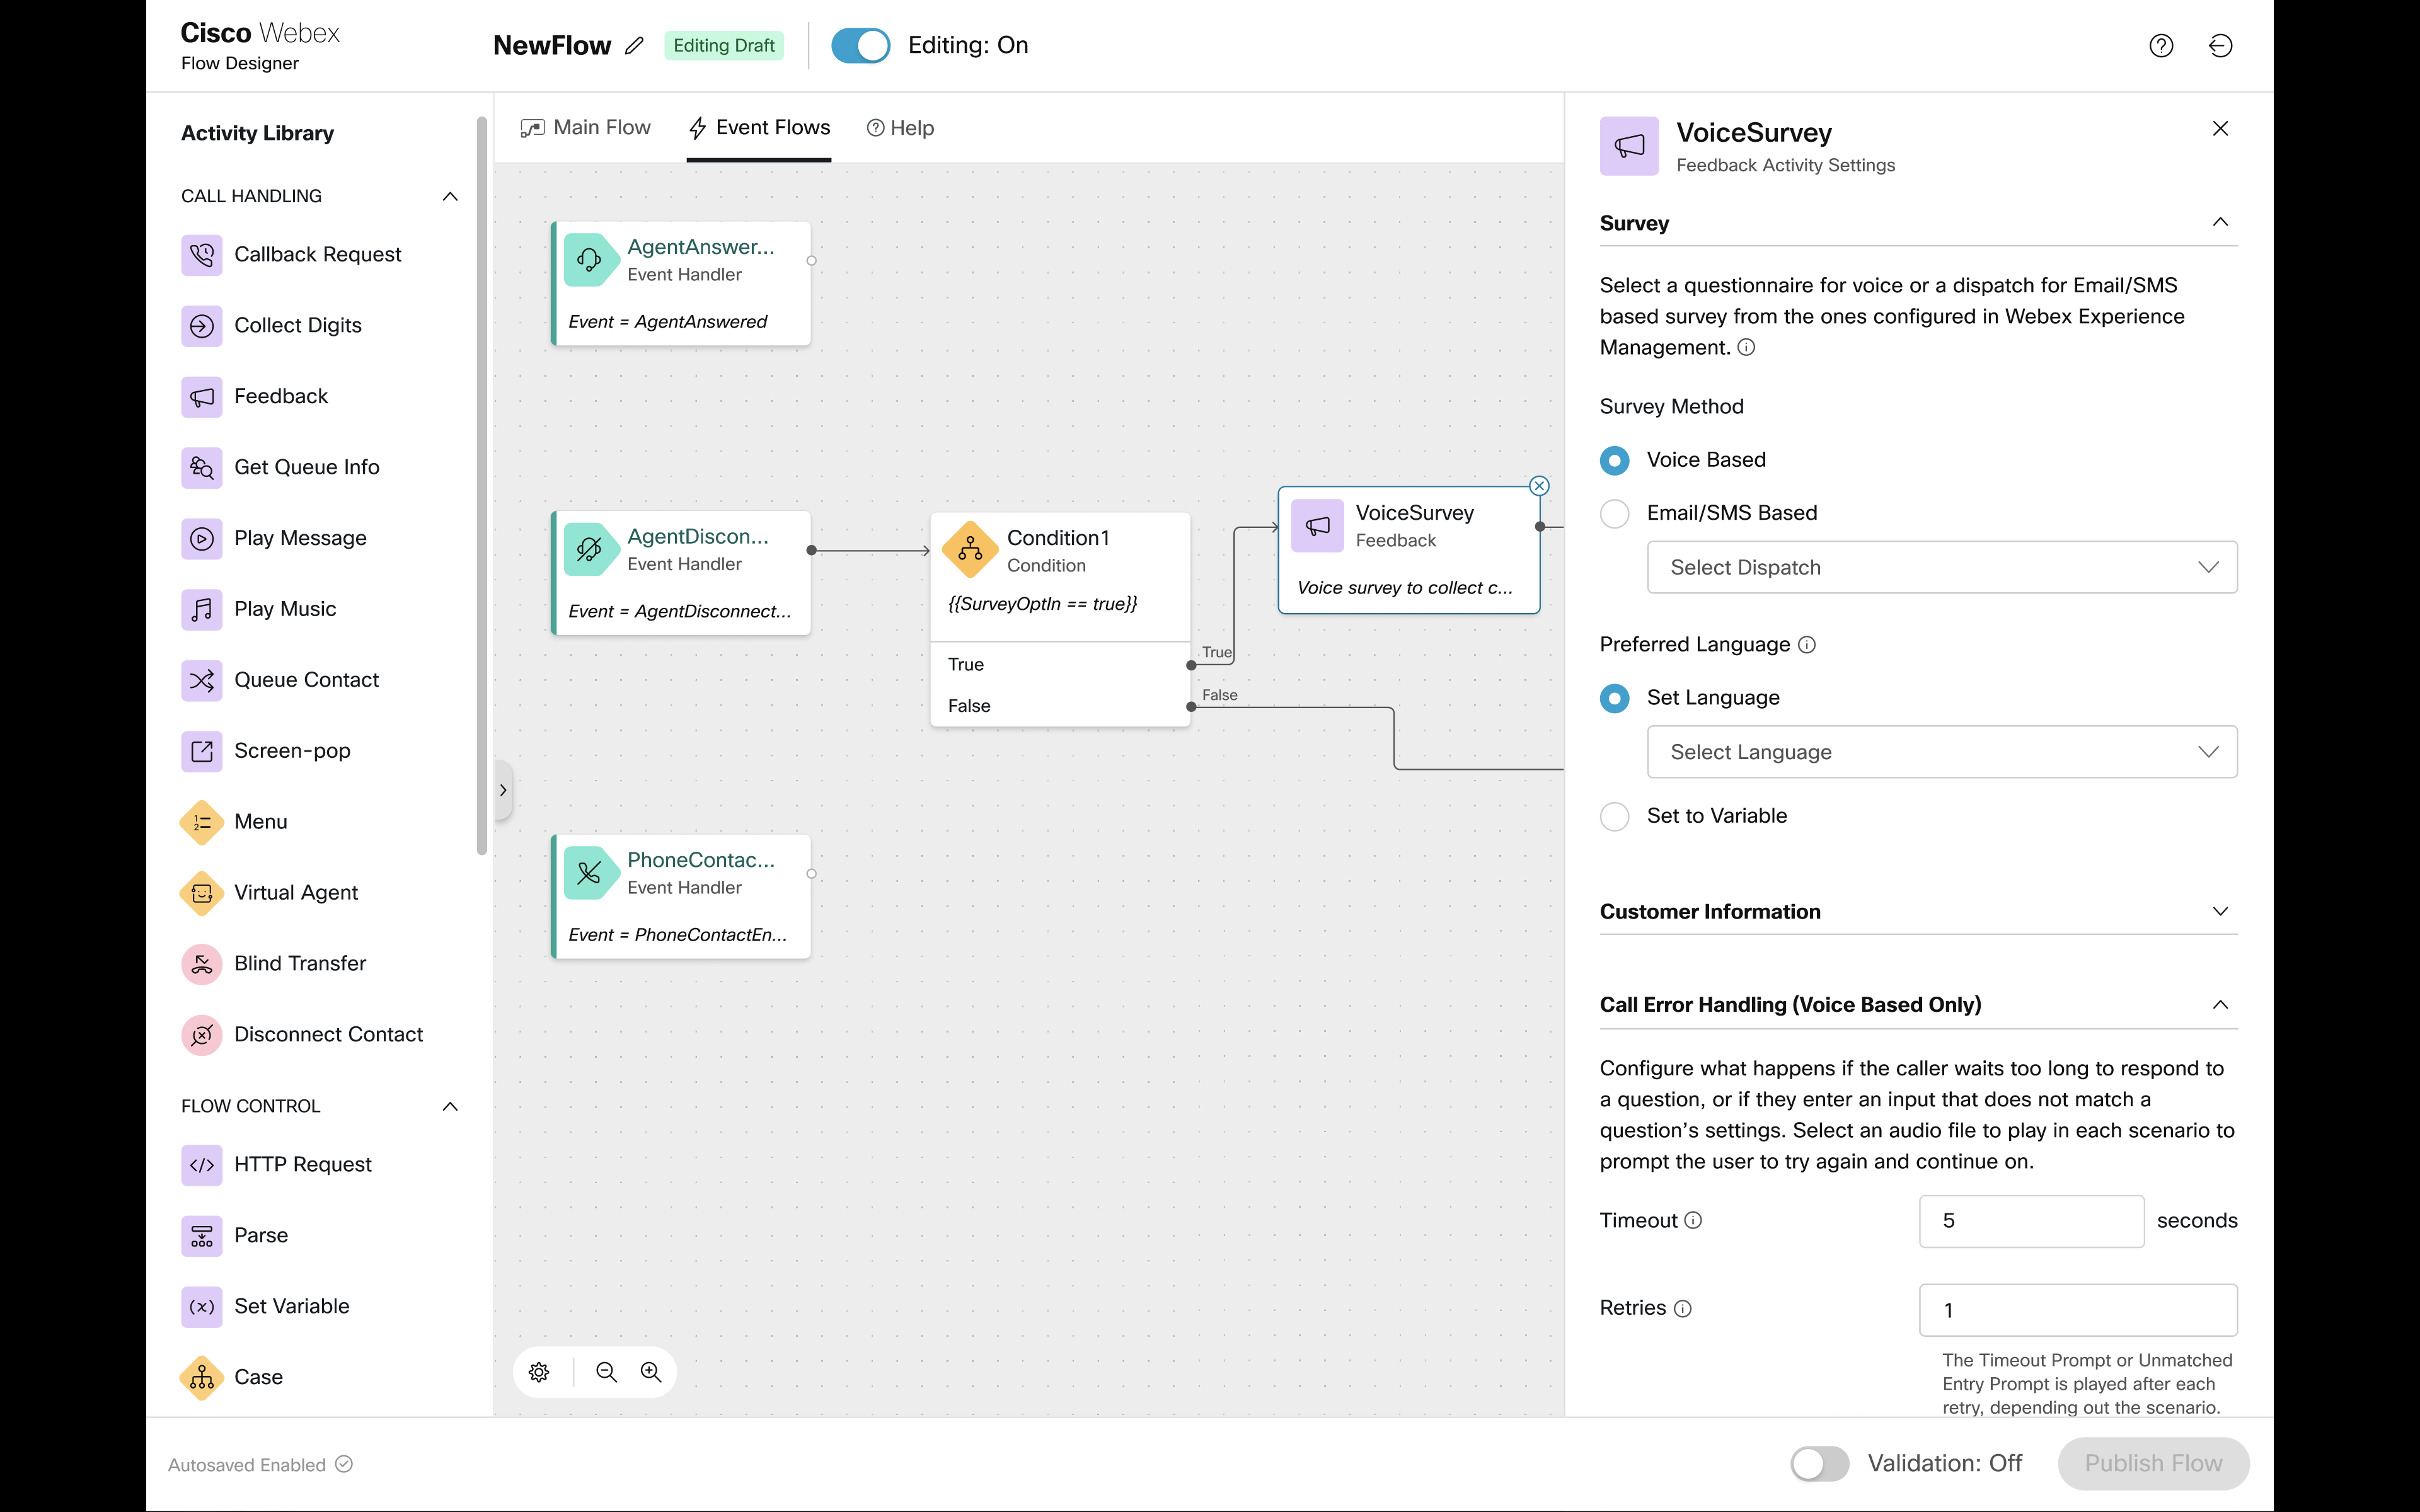
- Collect customer feedback using a channel of choice after their interaction with an agent.
- IVR feedback collection will happen in continuation of the call with the agent allowing customers to provide feedback in the context of the recent conversation.
- These insights will be available for agents as CEA gadgets in Webex Contact Center.
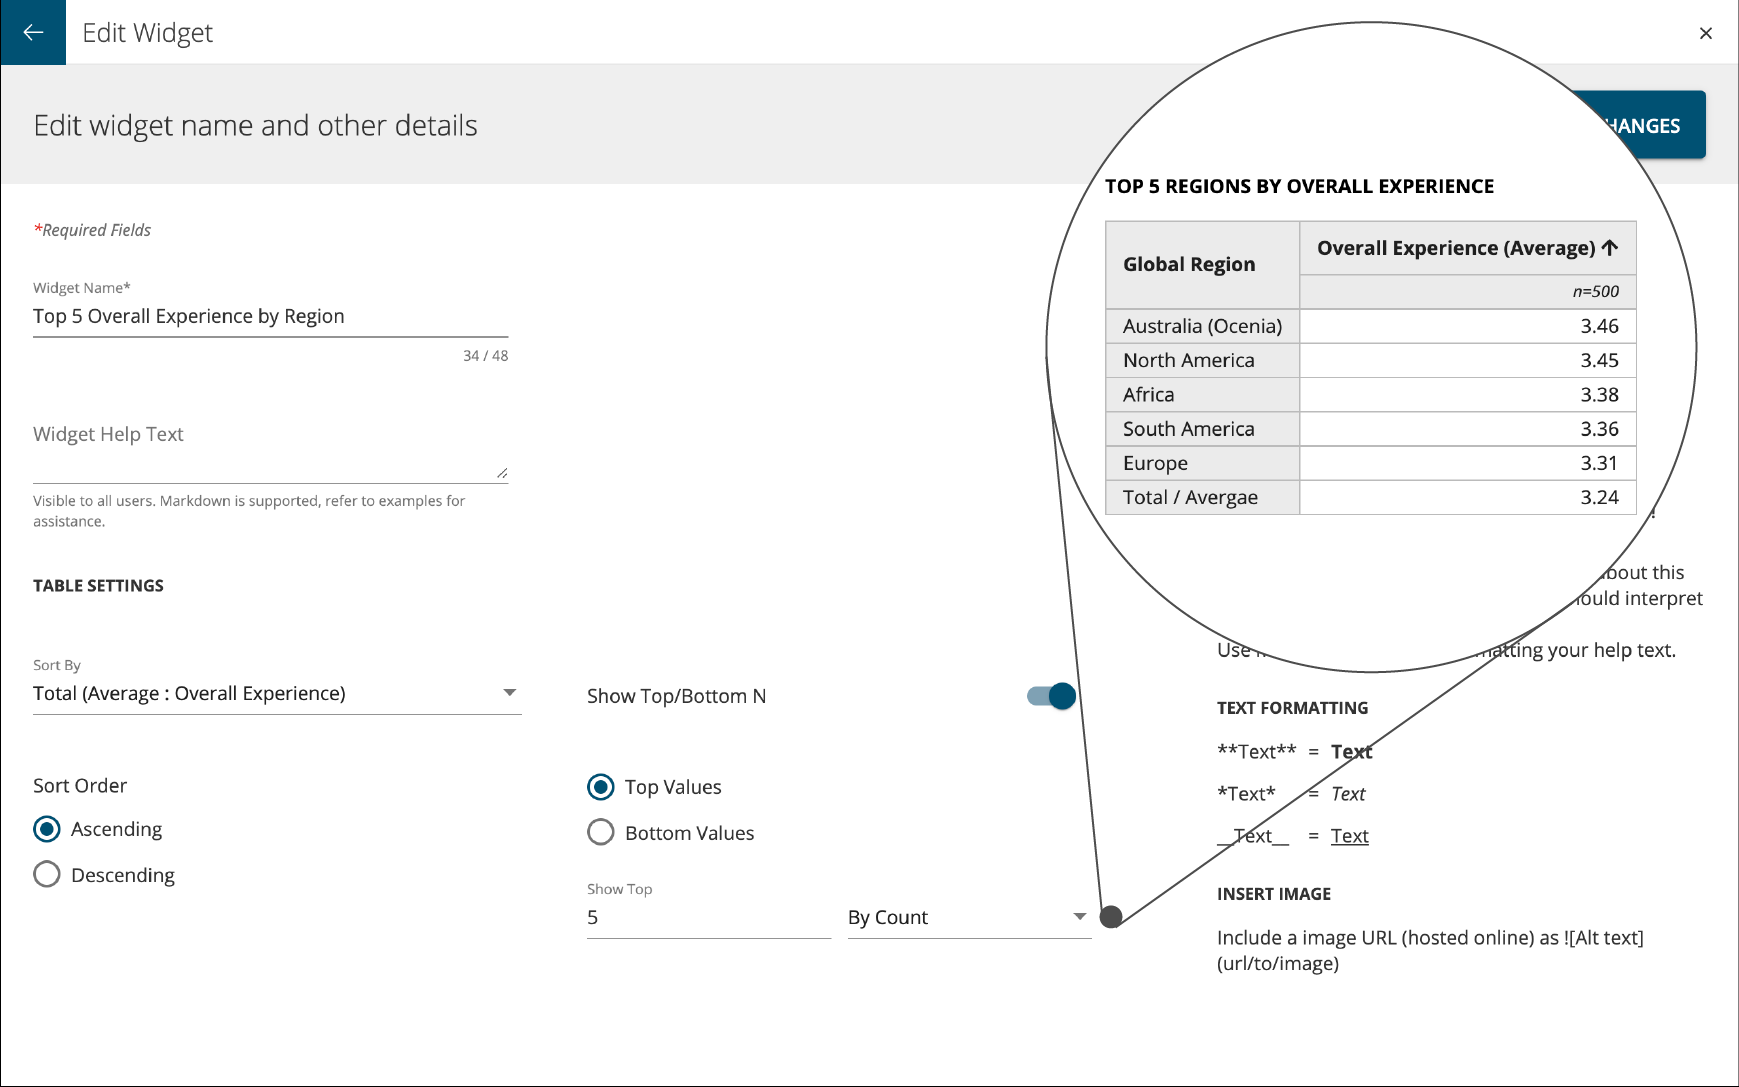
- Ability to publish Flat tables & Crosstab with a filter for top or bottom ‘n’ rows on any sorted column.
- Now, sorting will be available in Crosstab by any column with rows split by a single attribute
- Overall score on Flat table and reports
- UX improvements with frozen column and handling of longer question display names
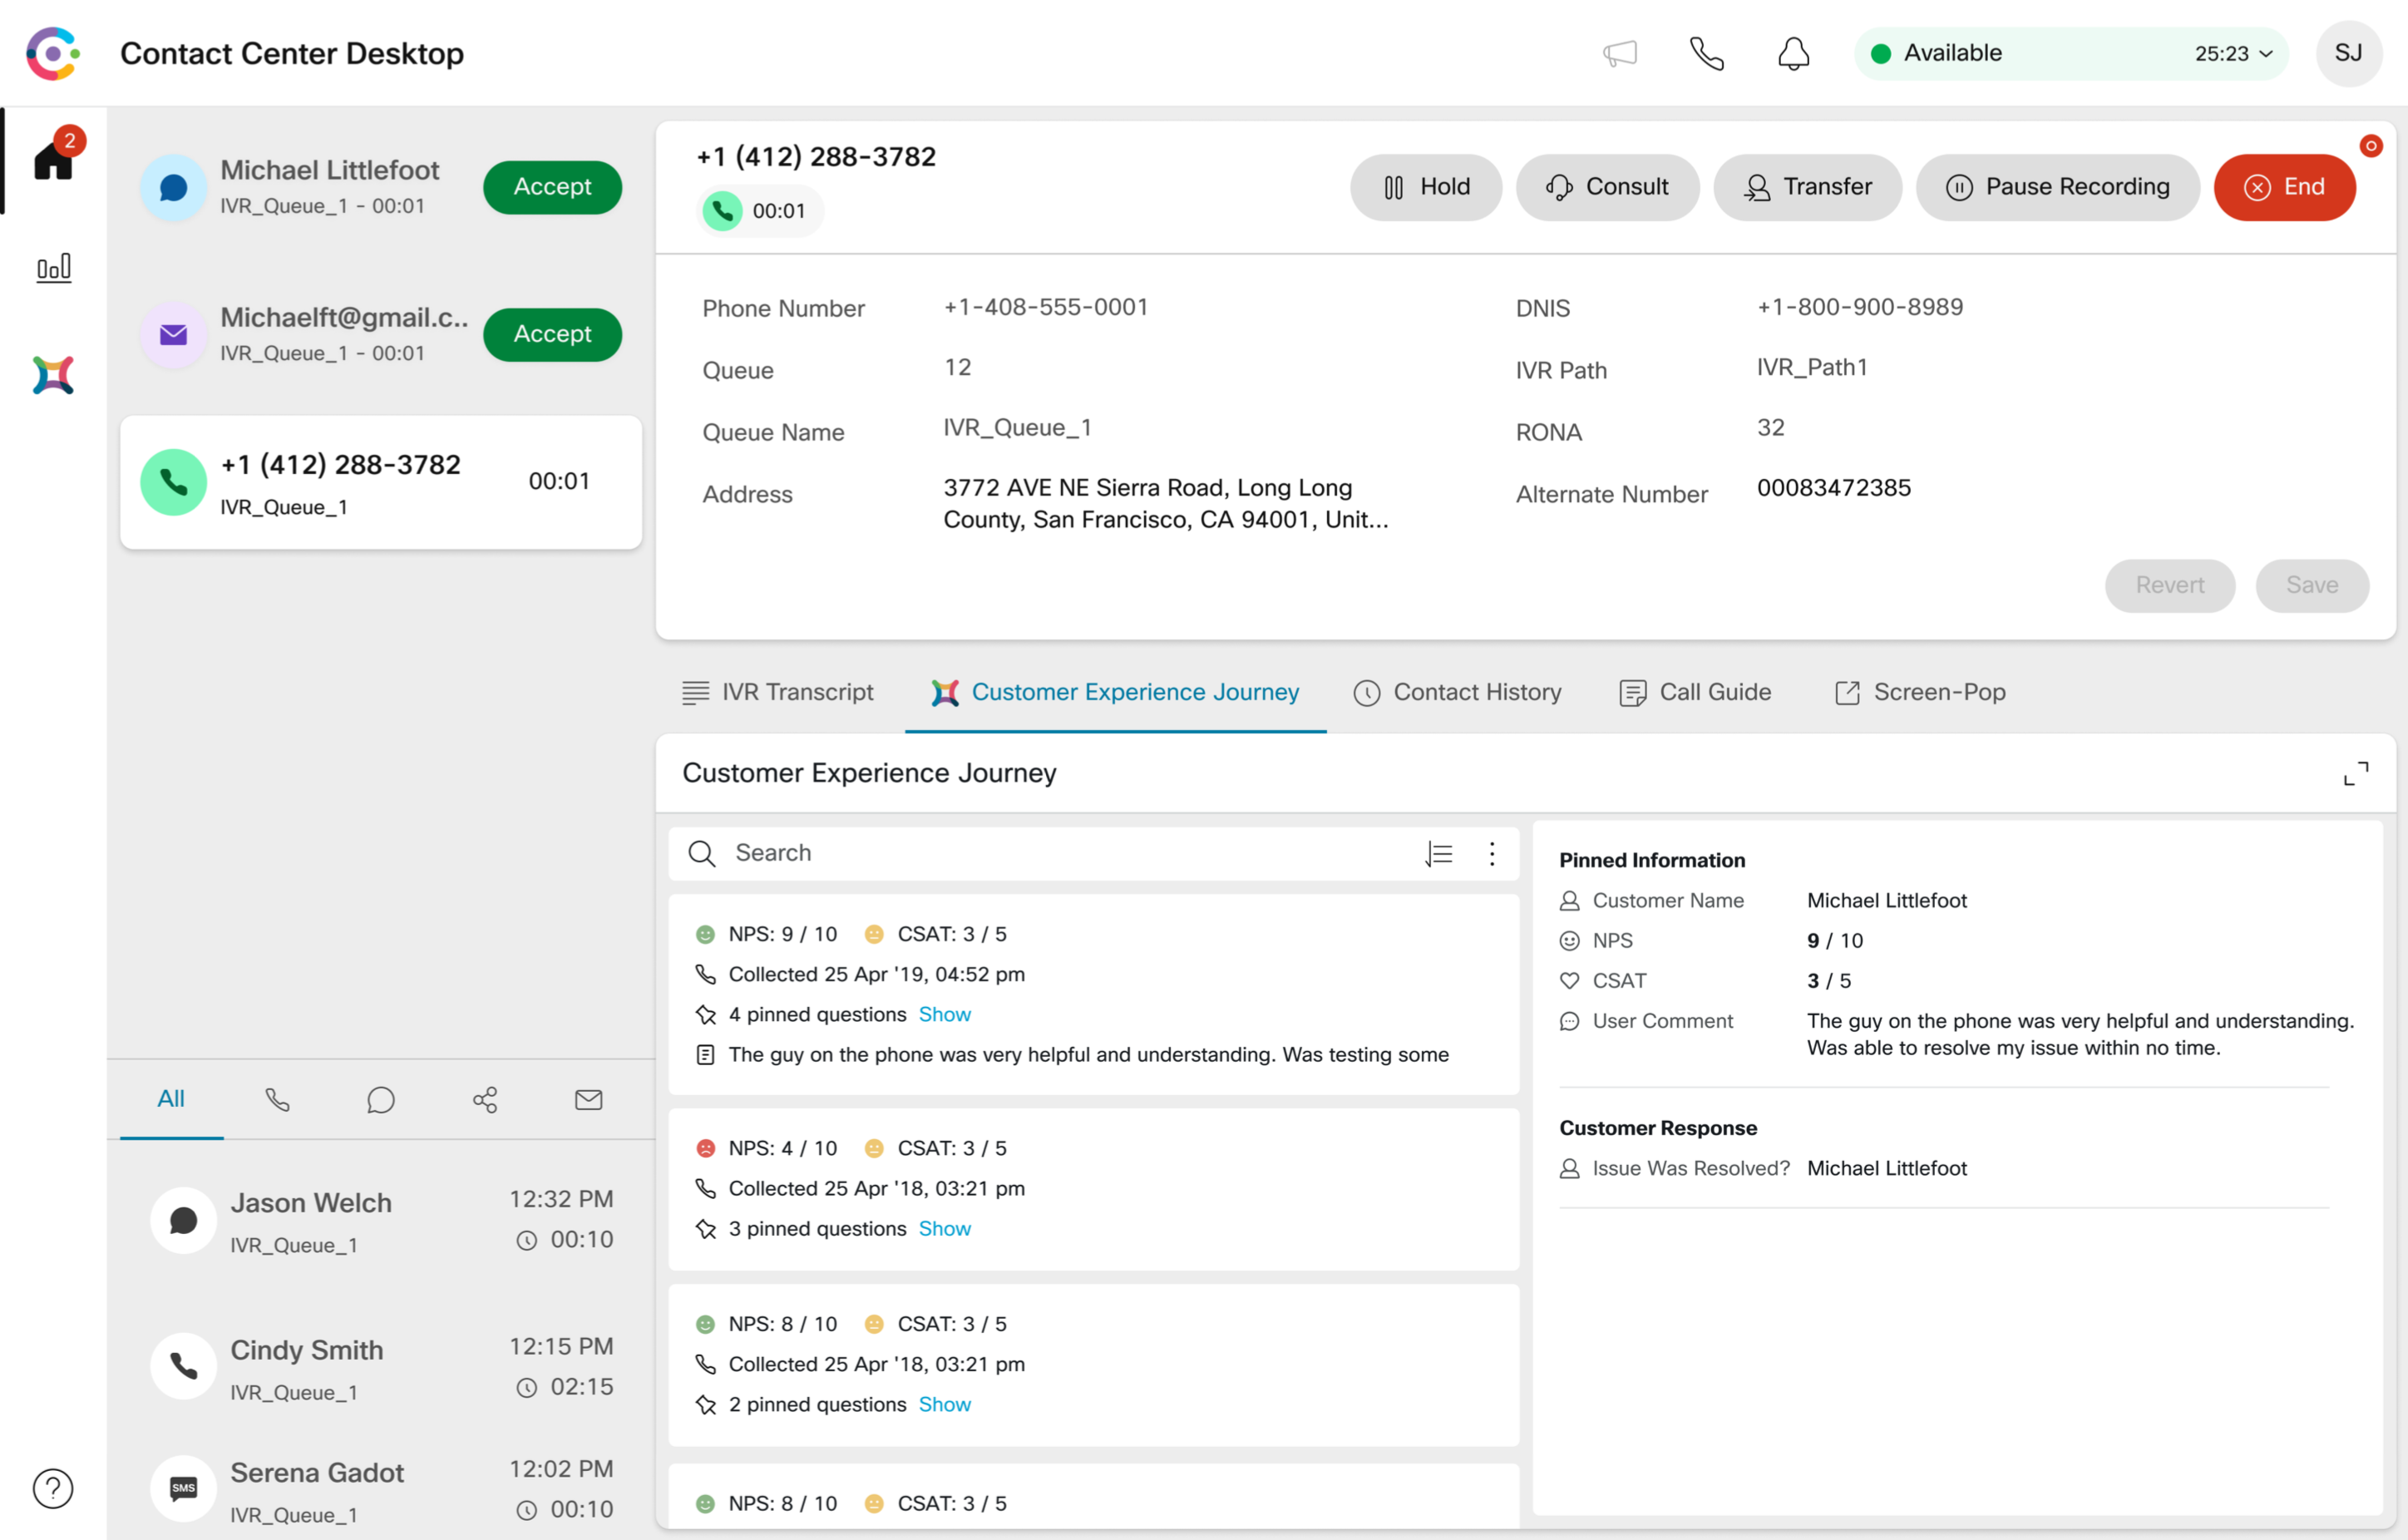
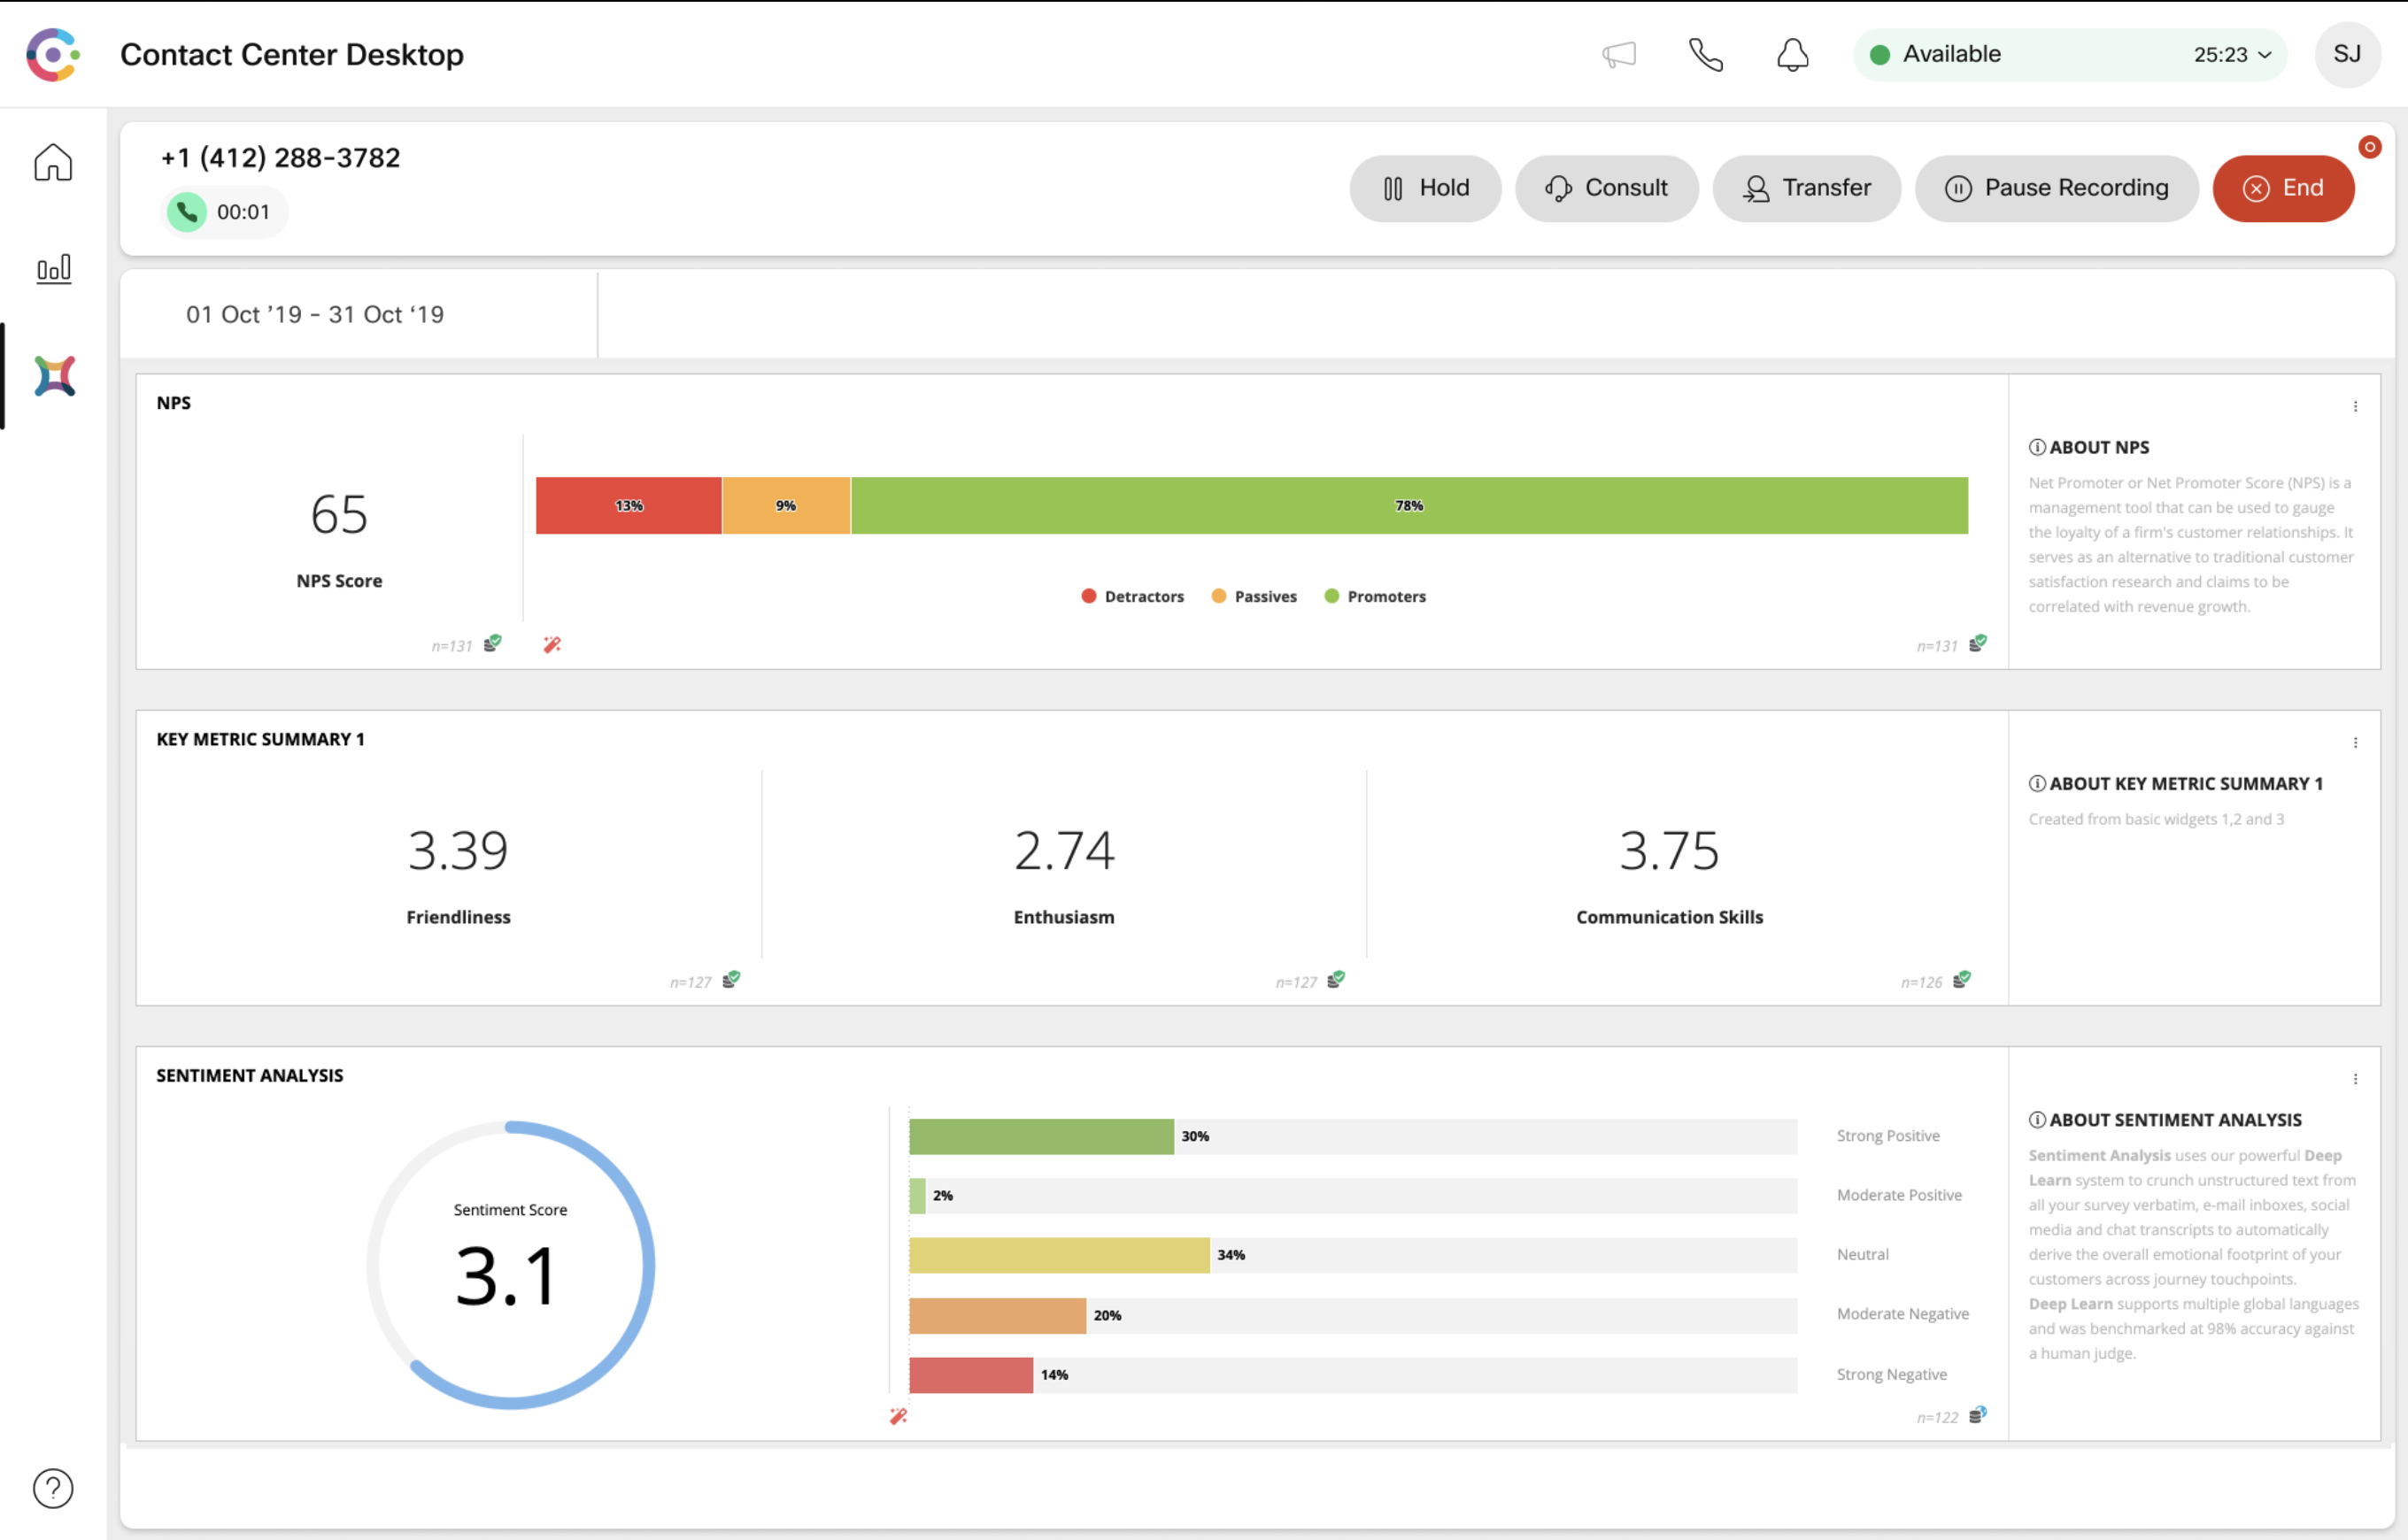
- Integrate Customer Experience Journey (CEJ) gadget across all channels including Voice, Email, and Chat conversations by an agent.
- Customer Experience Analytics (CEA) gadget will allow agents to view relevant metrics using customer feedback about them.
- Quick and easy way to export these gadgets from Experience Management into Webex Contact Center.
- Collect customer feedback using a channel of choice after their interaction with an agent.
- SMS and Email allow rich feedback collection using multiple rating and open text questions. This will enable deeper text analytics and predictive insights within Experience Management for the collected feedback.
- These insights will be available for agents as CEA gadgets in Webex Contact Center.
Now access insights on the go with our new Insights Center Mobile App. The new app is designed to align better with our recent update of the Insights Center and brings the same experience to mobile.
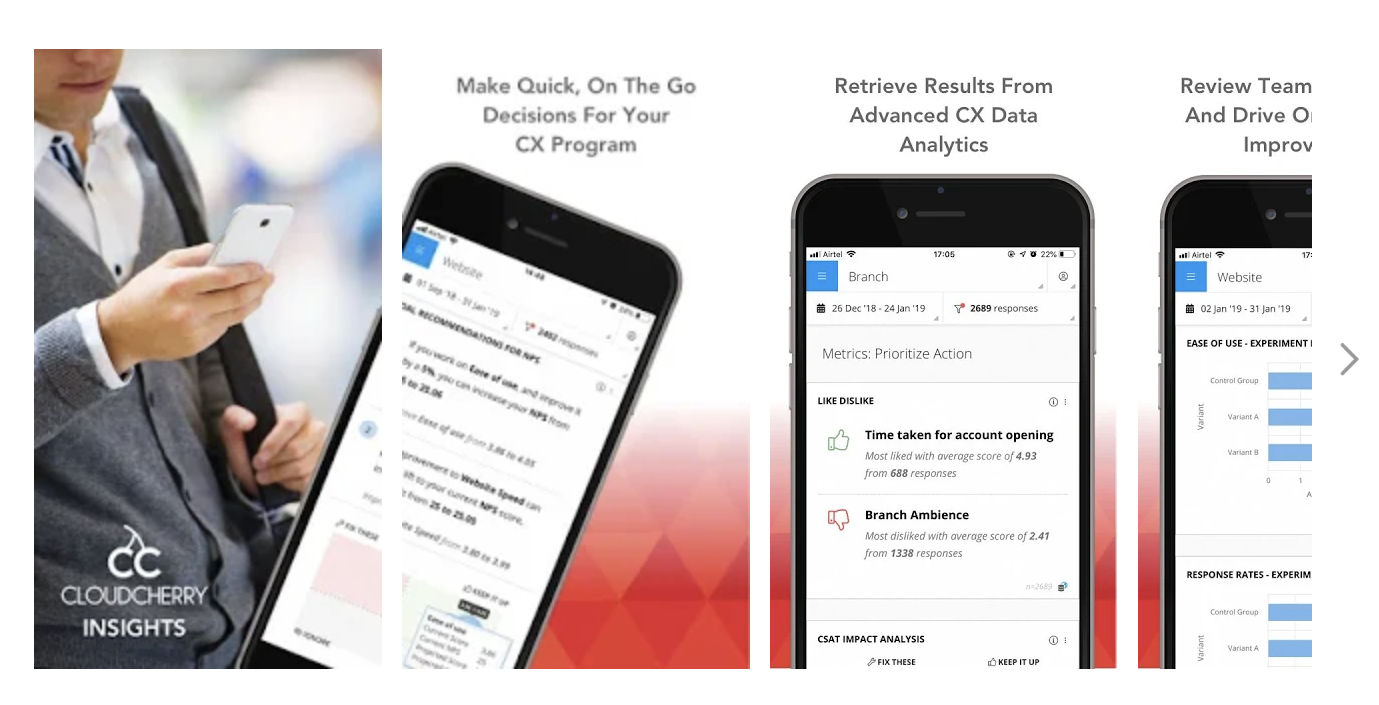
The mobile-friendly navigation menus help easily browse through spaces and set date filters. For frequent users, it will be easier to check pulse, monitor trends and compare journeys on daily basis.
- Updated mobile app to match the recent major release
- Viewing key dashboard metrics and access insights on the go
- The older mobile app is deprecated, and will be retired by October 2019
Download Preview App
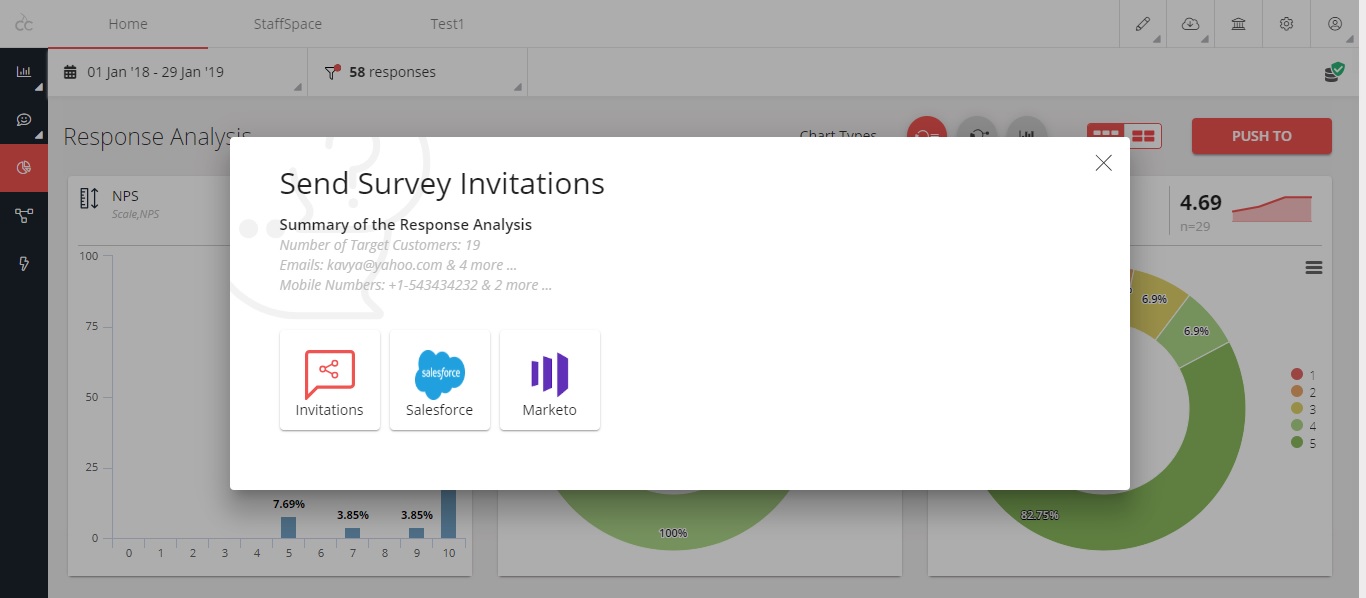
| Intelligent Webex Experience Management Segments | Better Marketo Campaigns |
|---|---|
 |
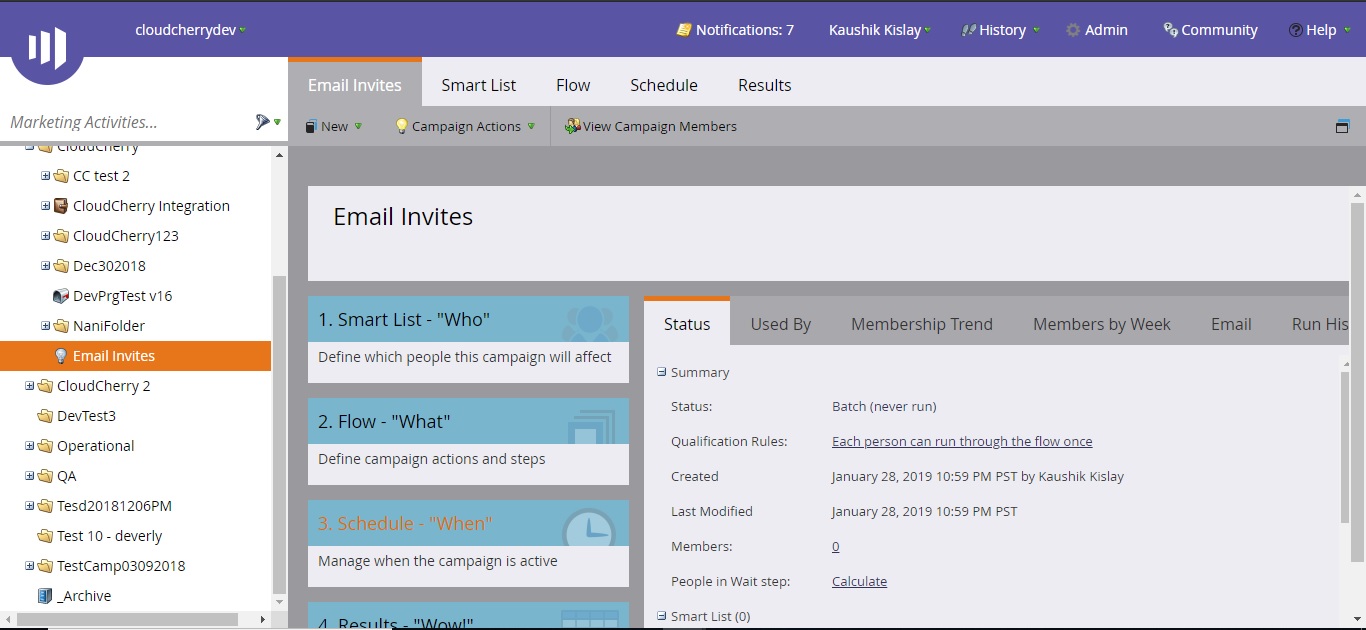 |
Our ready integration between Webex Experience Management and Marketo enables you to leverage the power of CEM and Marketing Automation together. Powerful features include:
- Easy creation of customer cohorts in Marketo as dynamic lists based on experiential characteristics, driving smarter, optimized campaigns
- Personalization of marketing campaigns in Marketo driving 1:1 engagement with customers based on CX data
- Run promotional campaigns based on experiential characteristics that have higher propensity to drive purchases
- Run win back campaigns targeting customers who may have had a bad experience later once you have driven improvements and addressed gaps in their journey
- Trigger Webex Experience Management surveys based on engagement in the customer journey mapped in Marketo via additional integrations
- Identify segments of interest in Webex Experience Management and link them to Marketo campaigns to identify demand loss, non-purchase, and drop offs to improve conversions
- Analyze and improve ROI of your marketing campaigns by improved targeting
We’ve updated the Webex Experience Management app on Freshdesk to support their lovely fresh Mint design.
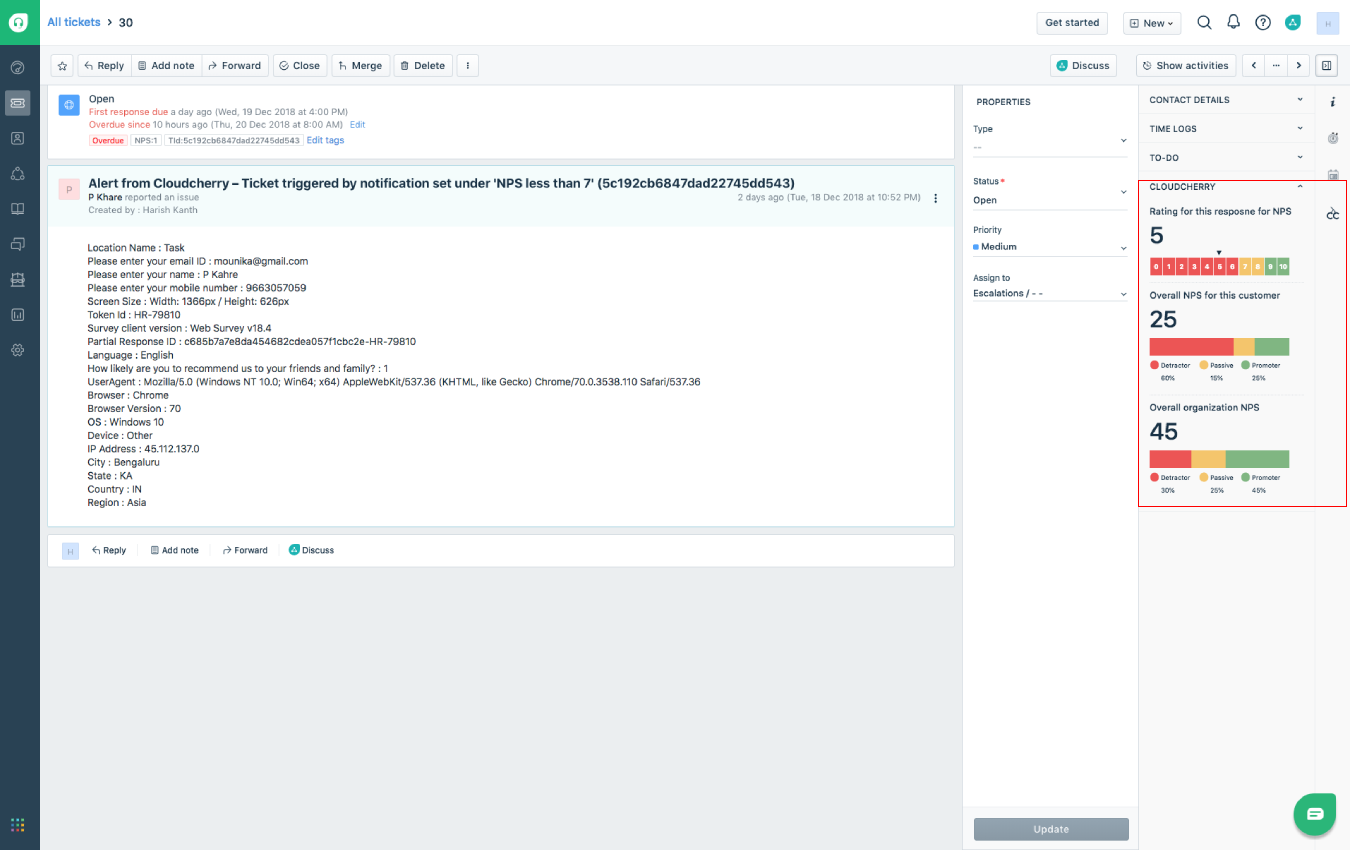
With this integration, get your CEM platform to work with your Freshdesk ticketing for grievance redressal based on customer feedback raised as tickets, close the loop & update data on your CEM Webex Experience Management platform with ticket status & more. The app will allow you to:
- Set up notifications in the Webex Experience Management platform and create tickets in Freshdesk.
- Freshdesk ticket information would be updated in the Webex Experience Management response automatically to understand what steps have been taken to close the loop with the customer.
- Agents/Admins can see information about the experience the customer has had based on which the ticket has been created.
The integration provides agent with enough context to proactively understand the customer’s concerns and reach out with the right solution to not just satisfy the customer, but delight them!
We’ve worked on making it easier for you to take a quick glance at your customer journey and understand where you need to take action.
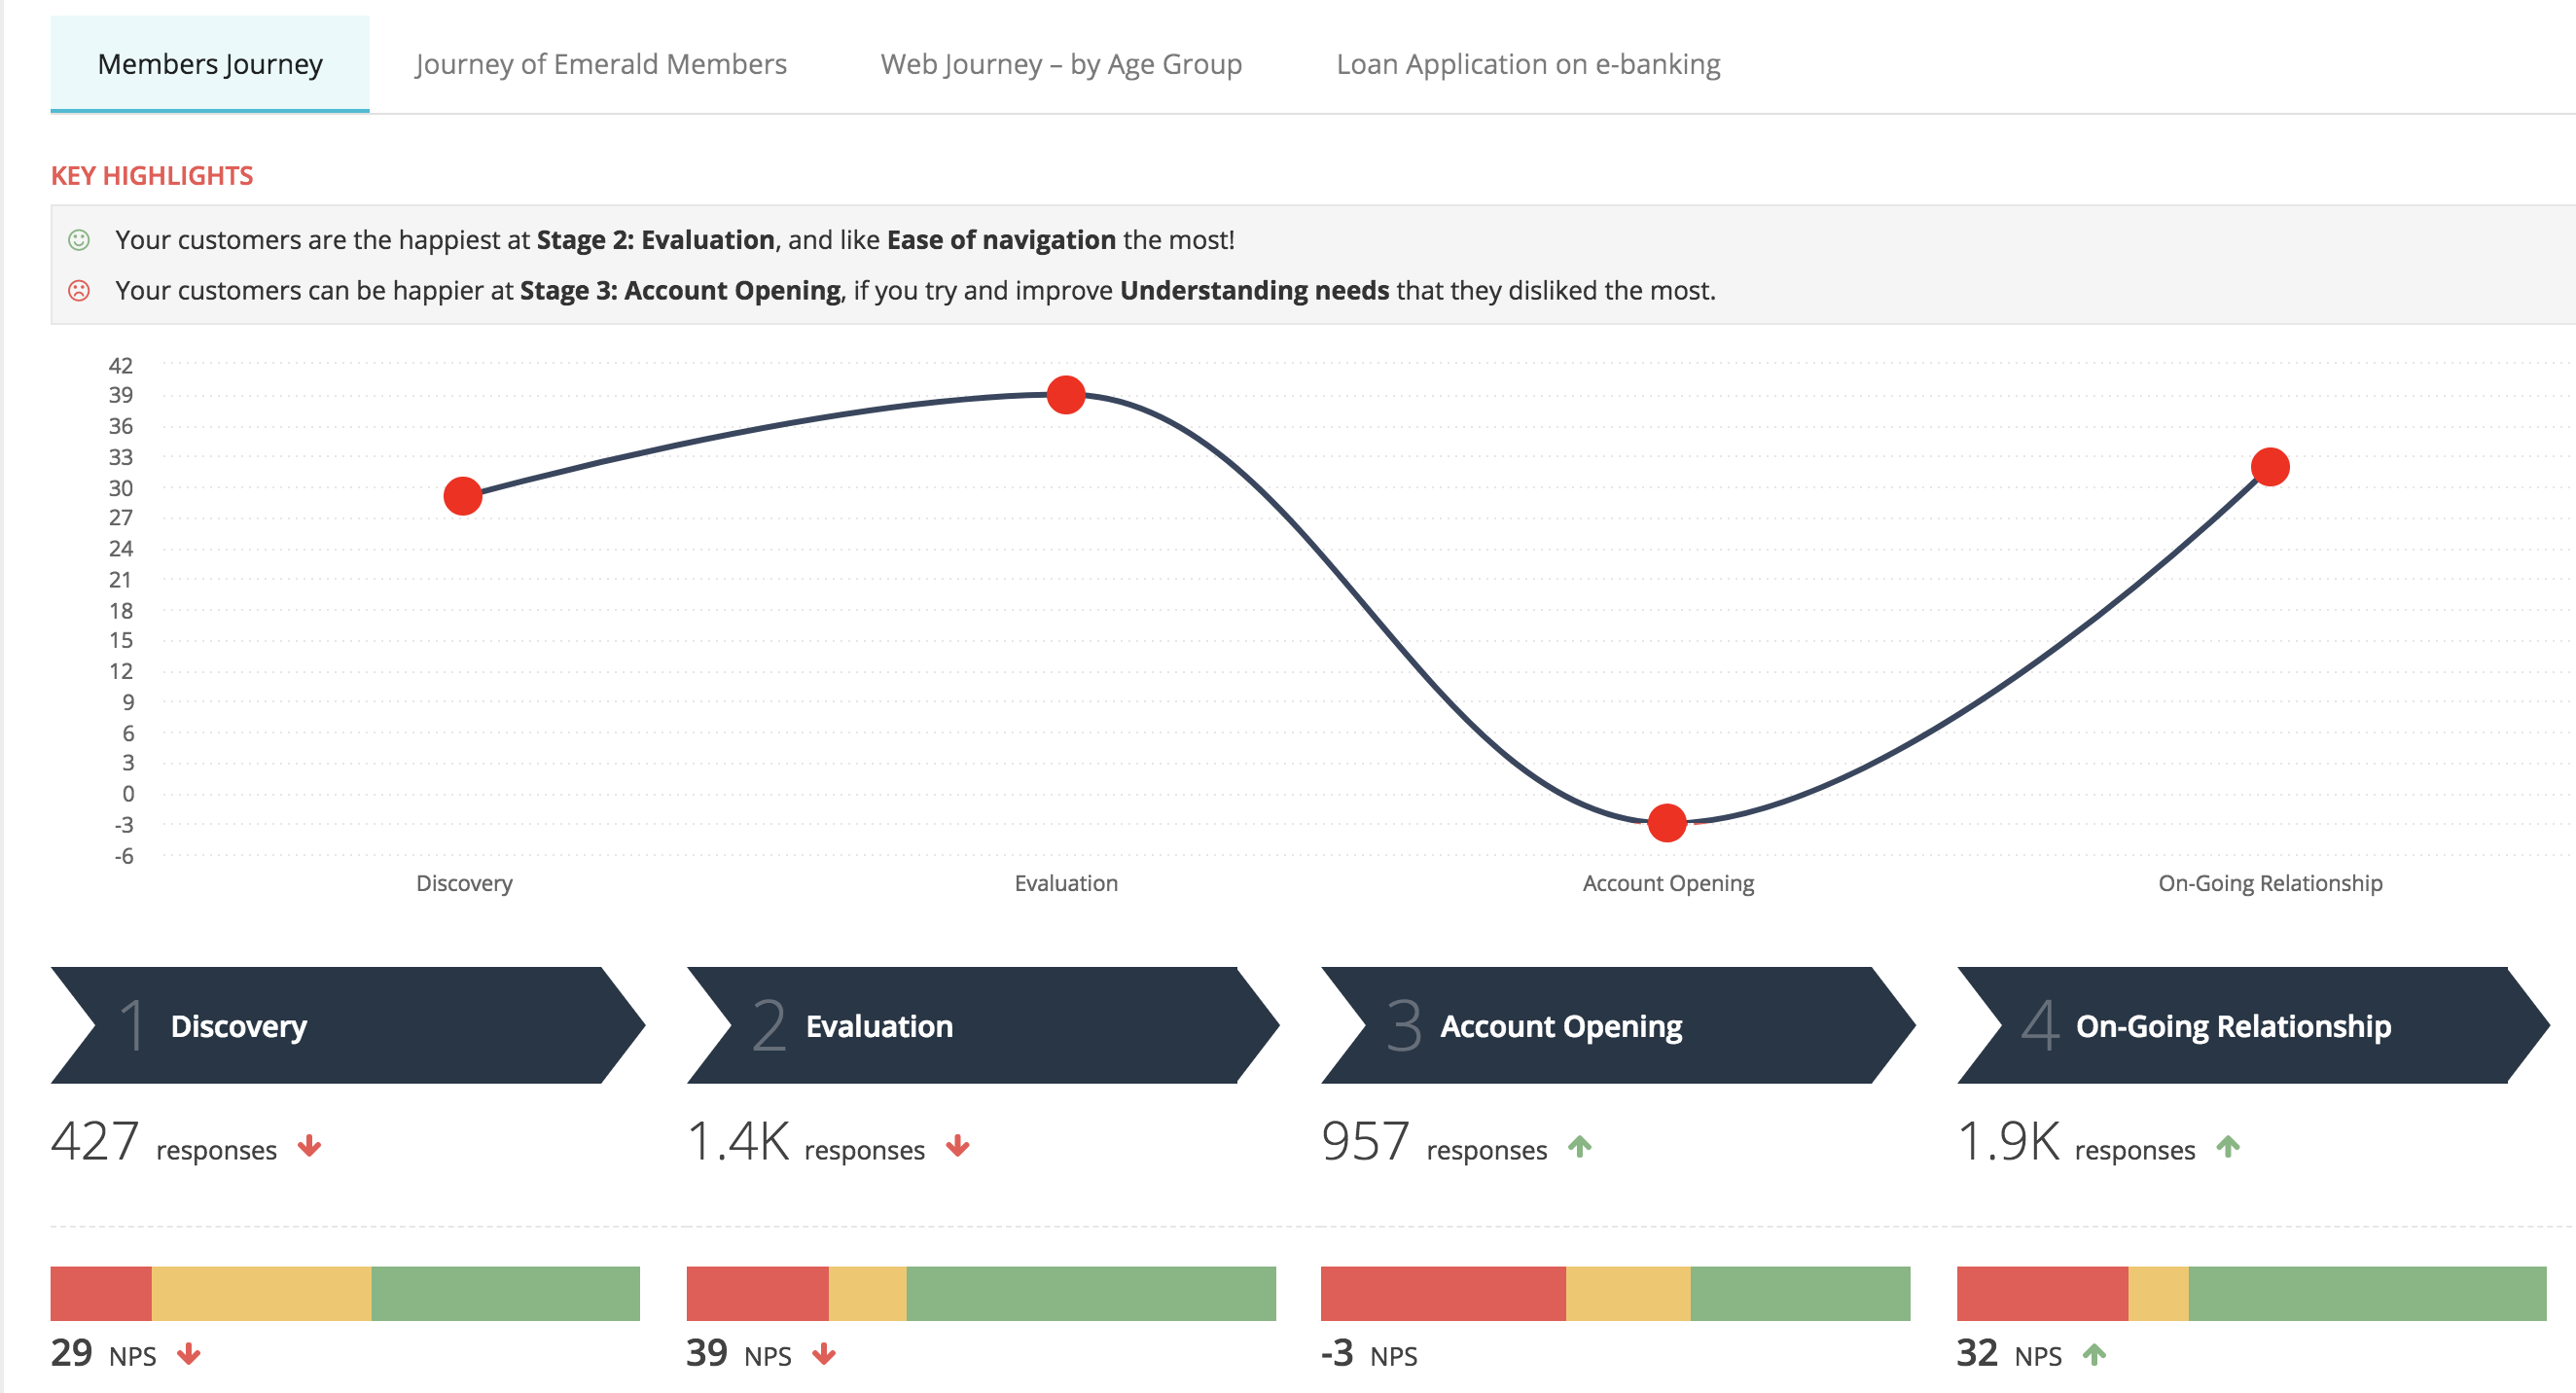
The curve plotted helps you quickly visualize the high points and low points of the journey of your customers. In this journey, Account Opening is the stage where customers are the most unhappy.
This works great with both macro and micro journeys, letting you start with an overall lifecycle and then drill down into specific journeys like users on your website or mobile app.