CEM Research for Data Analysts and Data Scientists
For the curious CEM data analyst or data scientist seeking to mine deeper insights from customer data, our Research module offers a swiss army knife of tools.
Every statistical analysis starts with a good clean data set. While it may sound easy, in reality organizing the data takes several days to ensure it is correctly sampled, clean, and valid for analysis. Webex Experience Management handles all of this automatically, letting CX data analysts work on the implementation of their statistical model instead of the plumbing. They can consume this data in R or other tools to build, test and validate further models.
Research Tools
Correlation
Linear Regression
Logistic Regression
Significance T-test
Path Analysis
Decision Trees⁺
Random Forest⁺
K-Means Clustering⁺
Structural Equation Modeling
Confirmatory Factor Analysis⁺
Topic Modeling⁺
⁺ through the Webex Experience Management R SDK
Ready integration with R
Our ready integration with R opens a range of possibilities for discovering CX insights as well as full flexibility for creating custom reports tailored to branding, layouts, visualization and export preferences.
Reports created using R or R Studio can be automatically updated by synchronization with Webex Experience Management over secure APIs.
Use CX Research Tools
Correlation
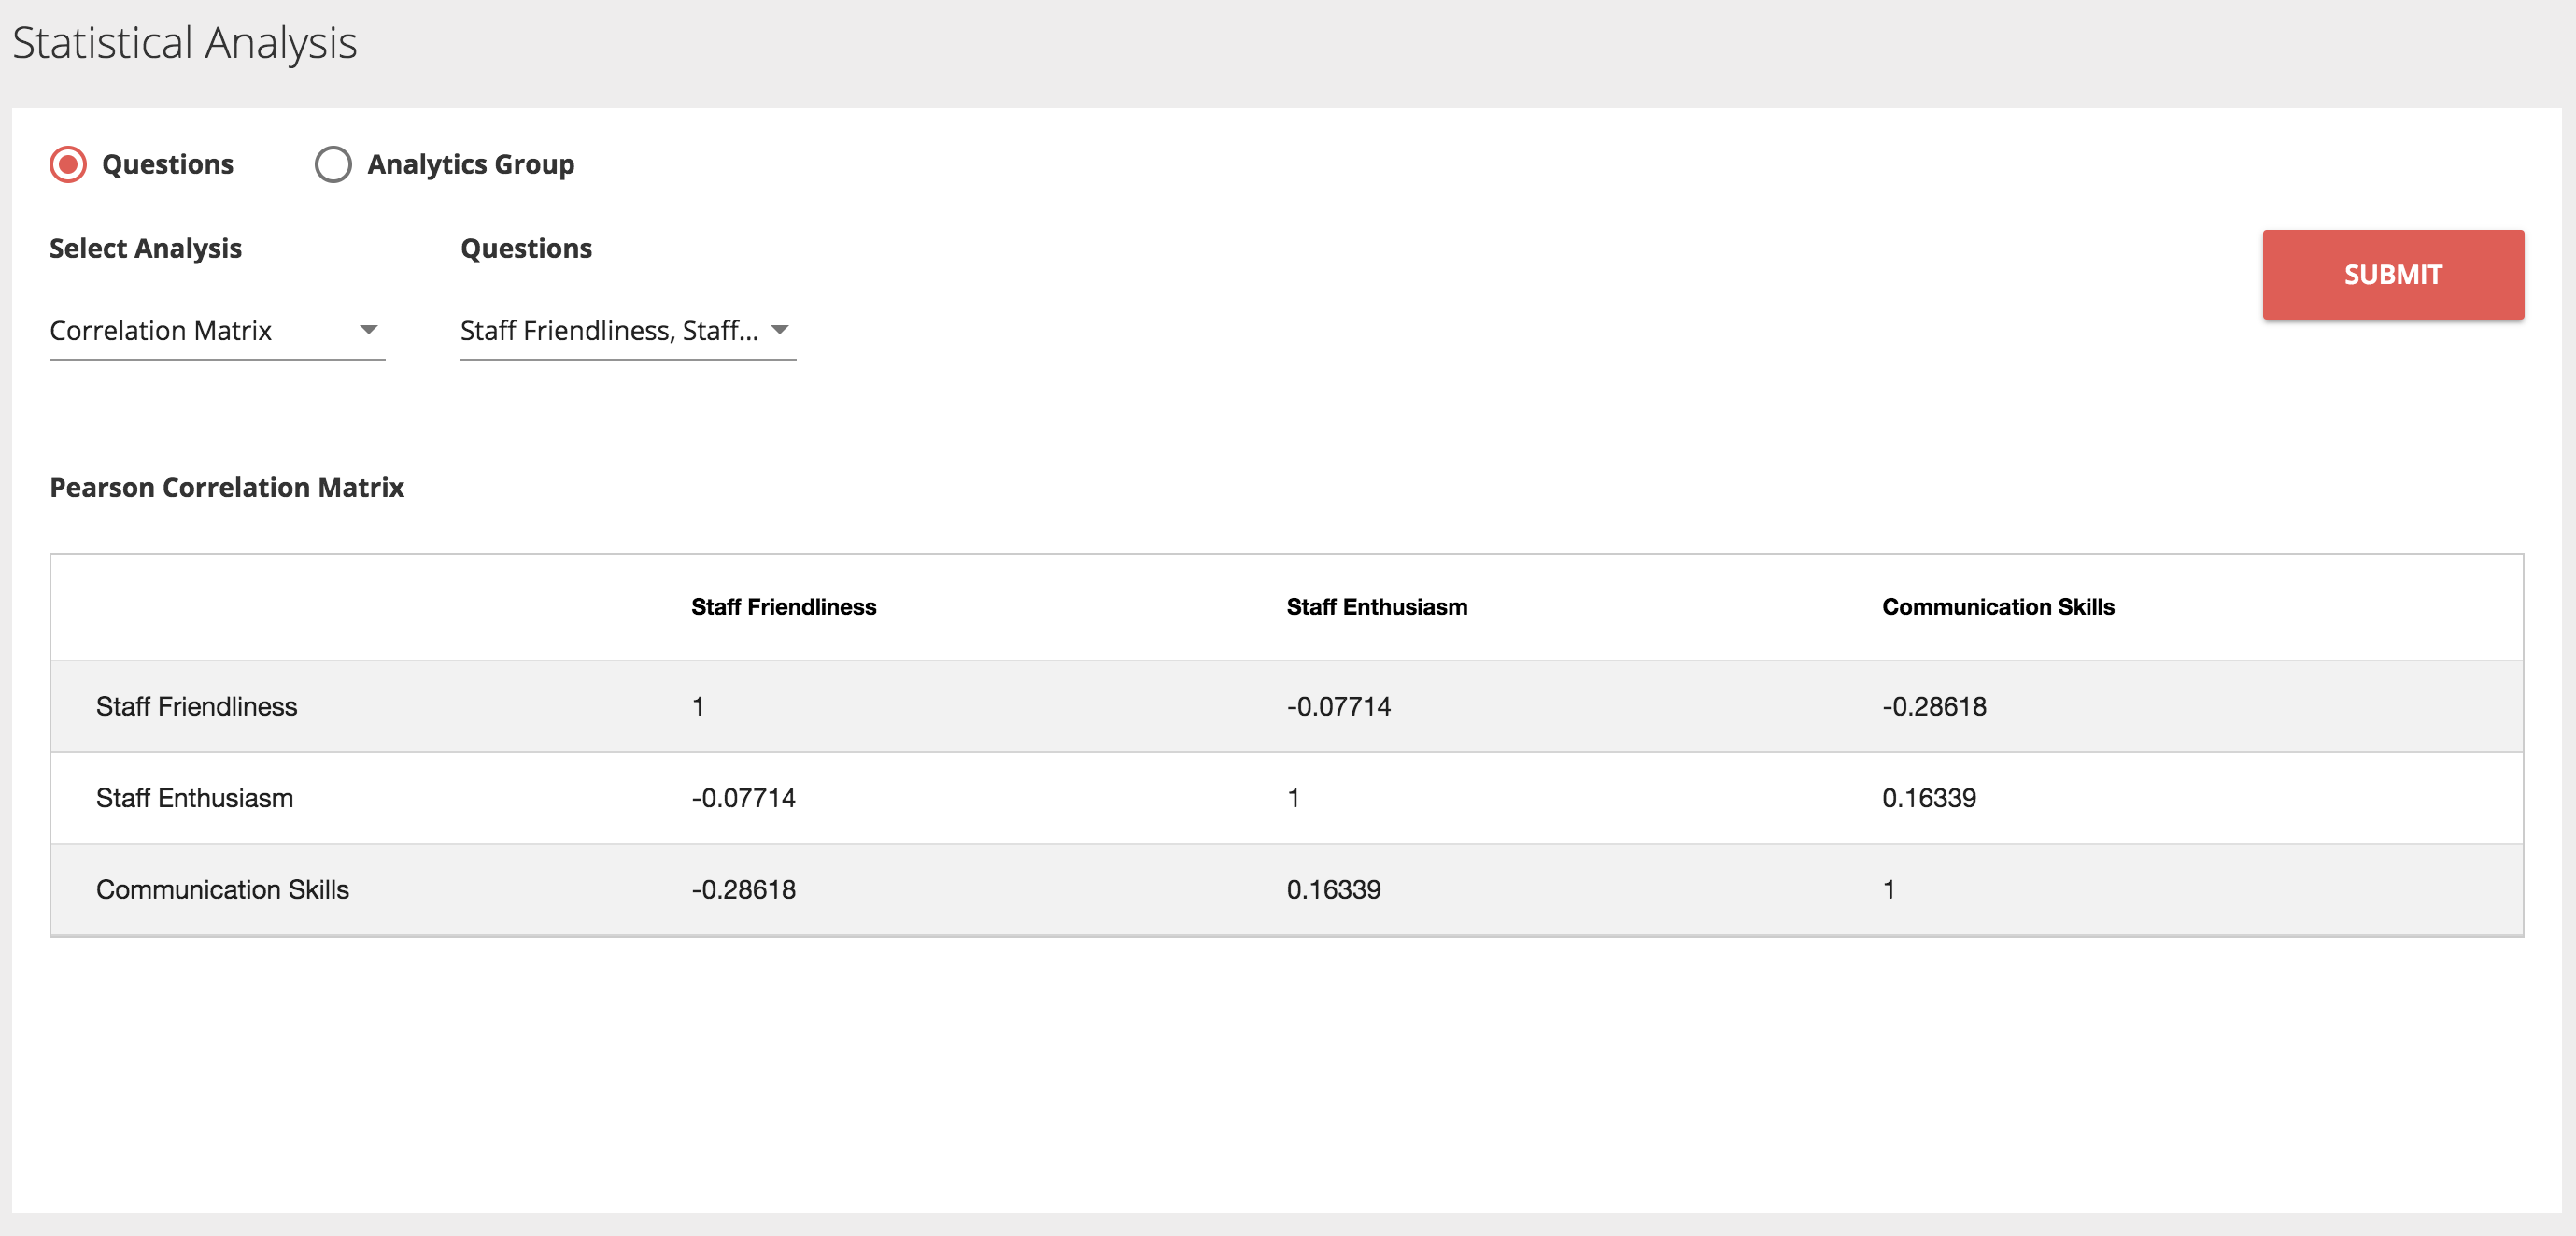
To run the Pearson Correlation, select the variables that you want to test the correlations between and click SUBMIT.
What is correlation analysis?
Use Correlation to establish the relationship between variables. Every business is posed with multitude of questions about whether and how strongly various CX and other business metrics are related.
Is here a relationship between store staff’s ability to give a customer relevant suggestion and the customer’s perception on the range of products available at the store?
Is there a relationship between the time taken to resolve a query and a customer’s satisfaction with the Call Center Executive?
Is there a relationship between customer satisfaction and the amount he/she spends at the store?
Though some of these correlations seem obvious, your data may contain unsuspected correlations. You may also be unaware of the strength of these correlations. Correlation analysis helps you determine just that - it tells you how much of the variation in one variable is related to the other variable.
Though correlation does not establish any kind of causation, it is a good starting point for understanding your data.
How to interpret the results?
Correlation coefficients have a value between -1 and 1. A ‘0’ means there is no relationship between the variables at all, while -1 or 1 means that there is a perfect negative or positive correlation.
Caveats for running Correlation Analysis
Correlation analysis can be run only on quantifiable data ie rating scale data or numeric data (like age, basket size, transaction amounts)
It cannot be run on categorical data like gender, products purchased, transactions conducted
Linear Regression
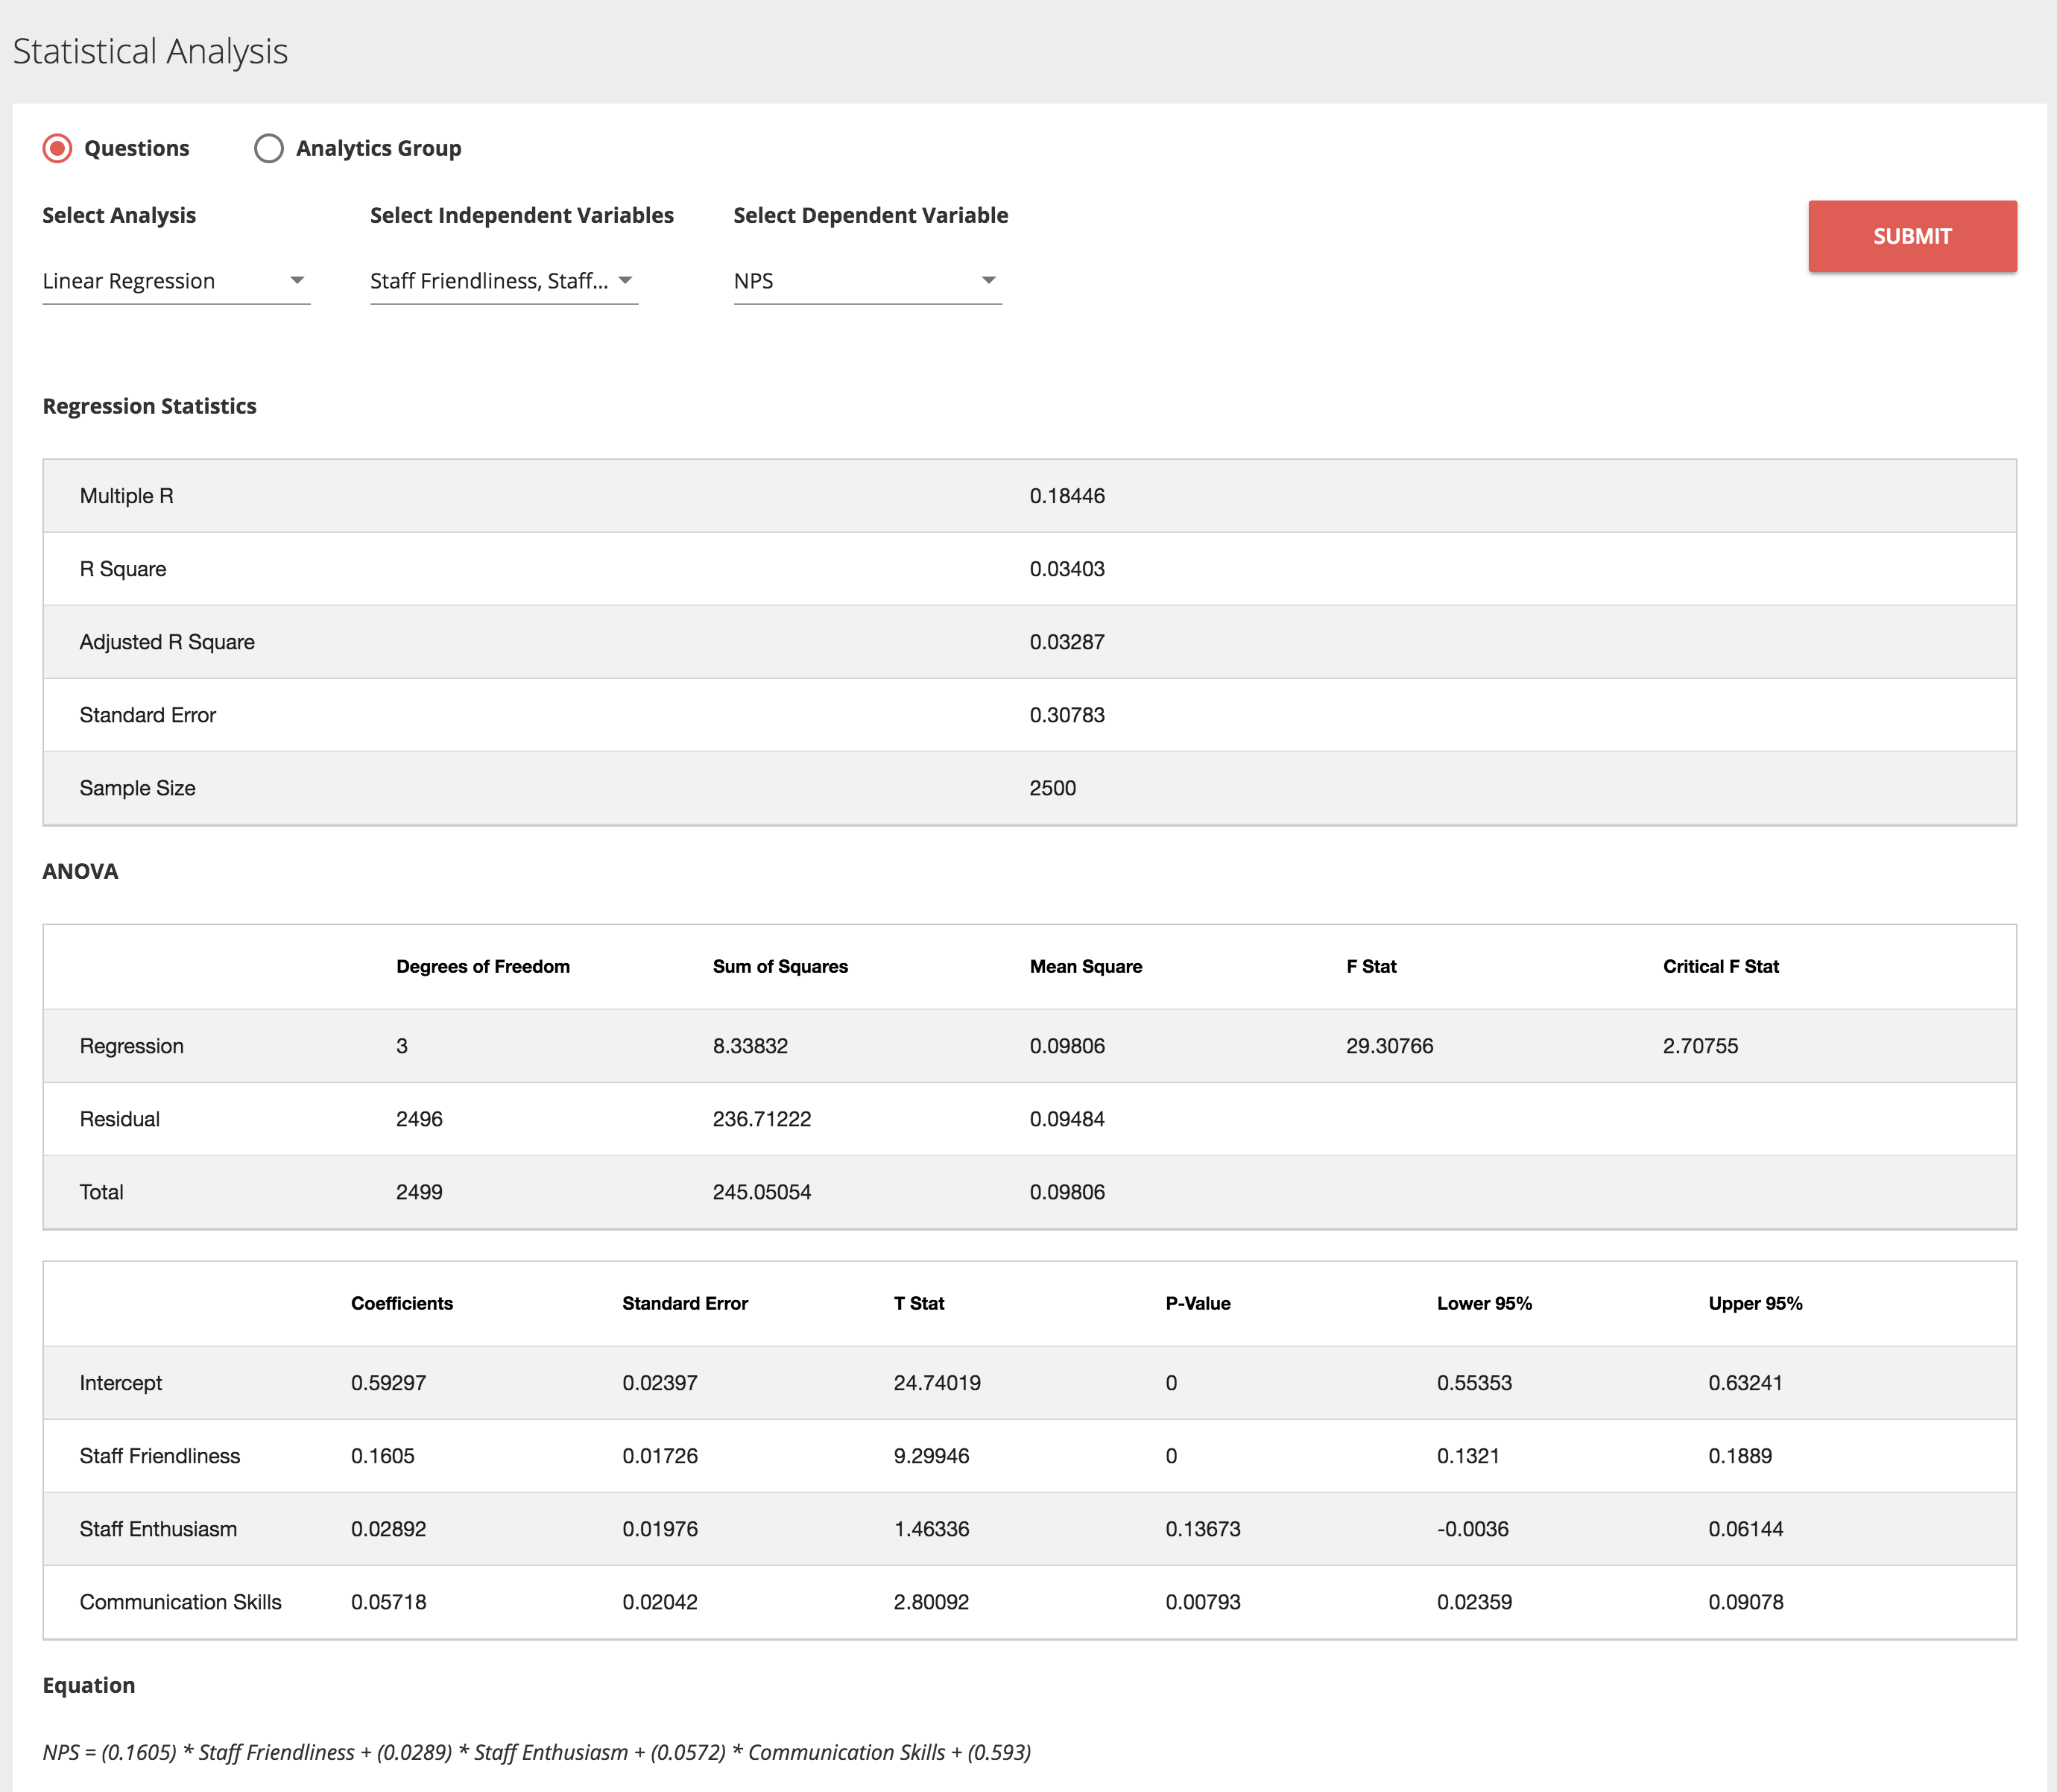
To run the Linear Regression, first select the independent variables that you want to analyze. Next, choose from the available dependent variables and click SUBMIT. The list of dependent variables is automatically filtered to present a list that are suitable for running a linear regression.
What is regression analysis?
Regression analysis is the simplest form of predictive modeling technique which can be used to estimate causal relationships between CX data. This can be further used for forecasting and time series modelling.
How does Regression analysis enable your brand in decision making?
Predict your brand NPS based on the performance on your experiential metrics
Predict your customer’s purchase decision based on his evaluation of the experience offered at your store
Furthermore, you can also establish how important each experiential metric (predictor variables) is in impacting the business metric (dependent variable) and align your business in driving performance on those metrics.
When is linear regression used?
Linear Regression is used when your dependent variable is continuous (ie NPS, CSAT, CES) and your independent variables are either continuous or discrete.
How to interpret the results?
The results of Regression Analysis on Webex Experience Management dashboard are exactly as you would see it on Excel.
Table 1. Regression Statistics:
It gives you the Model Summary. It tells you how good the model fit is.
Multiple R: It is the Correlation coefficient. It tells you how strong the linear relationship between the dependent and the independent variables
R Square: It is Coefficient of determination. It is used to analyze how well differences in the dependent variable can be explained by the differences in the independent variable
Adjusted R Square: This is used when we have more than one independent variable in the model. It adjusts the statistics based on the number of independent variables. Higher the R Square, better is the model fit
Standard Error: It is the precision of regression coefficients ie it tells us how accurate the predictions are
Sample Size: It is the sample size on which the analysis has been performed
Table 2. ANOVA Table.
It tells you how the regression equation accounts for variability in the response variable
Table 3. Testing for Significance & Building the linear equation
Testing for Significance: T Test is used to test for significance of the regression analysis model. The t test for regression tests the following hypothesis:
Null Hypothesis Ho= There is no relationship between the independent variable and the dependent variable
Alternate Hypothesis Ha= There is a linear relationship between the independent variable and the dependent variable
Rule of rejection: Reject Ho if p<α
Building the linear equation: Use the coefficients to define the linear equation
Logistic Regression
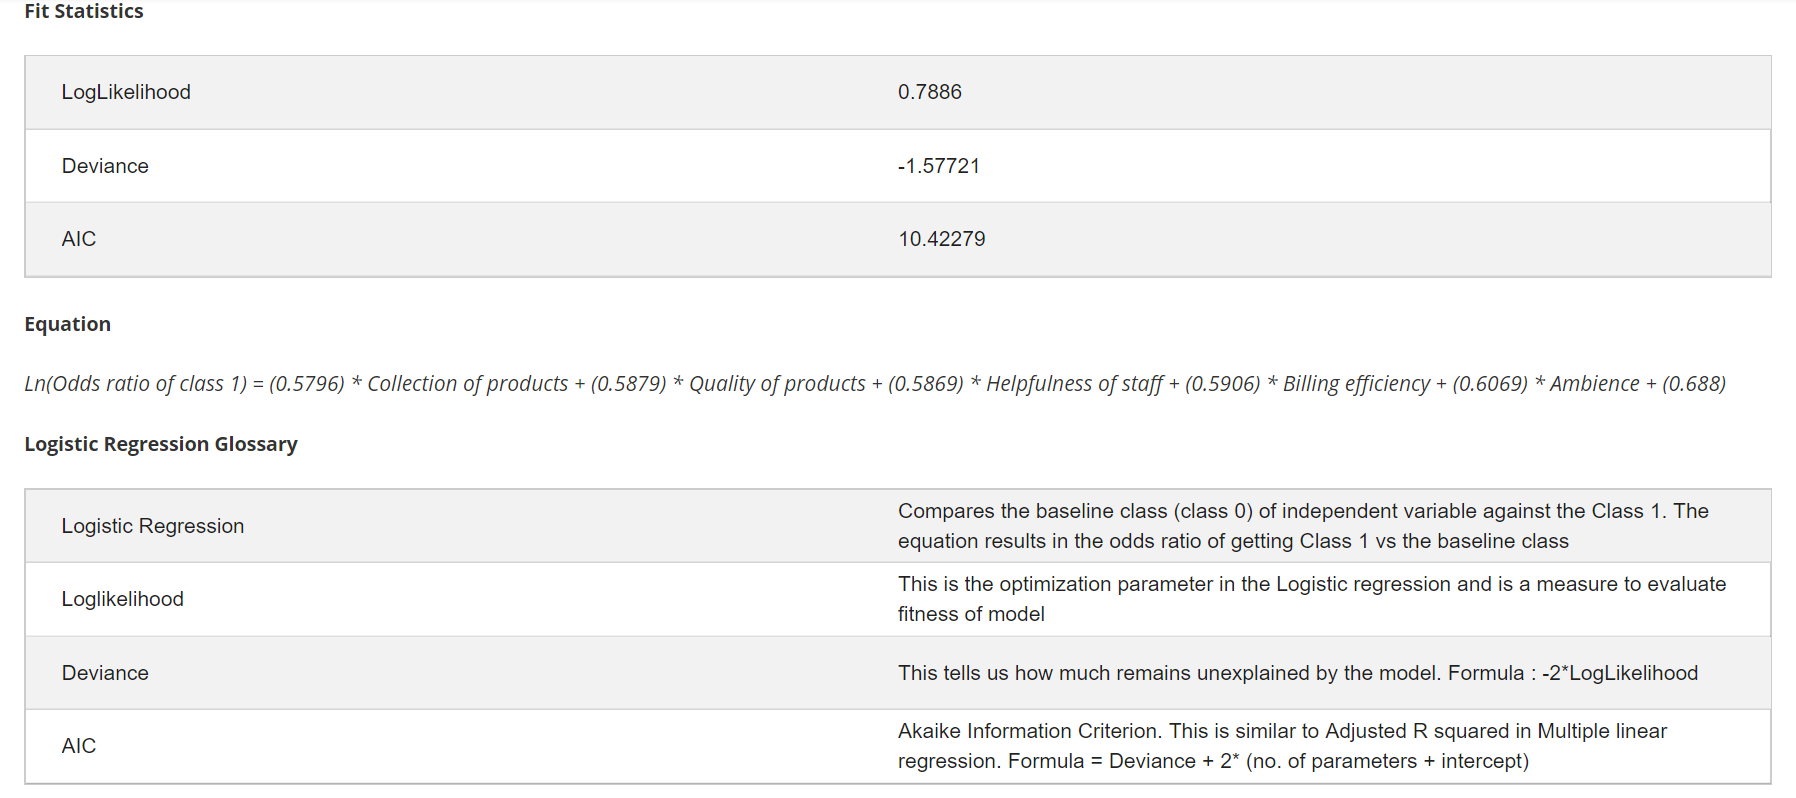
To run the Logistic Regression, first select the independent variables that you want to analyze. Next, choose from the available dependent variables and click SUBMIT. The list of dependent variables is automatically filtered to present a list that are suitable for running a logistic regression.
When is logistic regression used?
Logistic Regression is used when your dependent variable is binary in nature ie when you are trying to establish the probability of an event being success (1) or failure (0) (eg: Customer will make a purchase= Yes/No)
Significance T-test
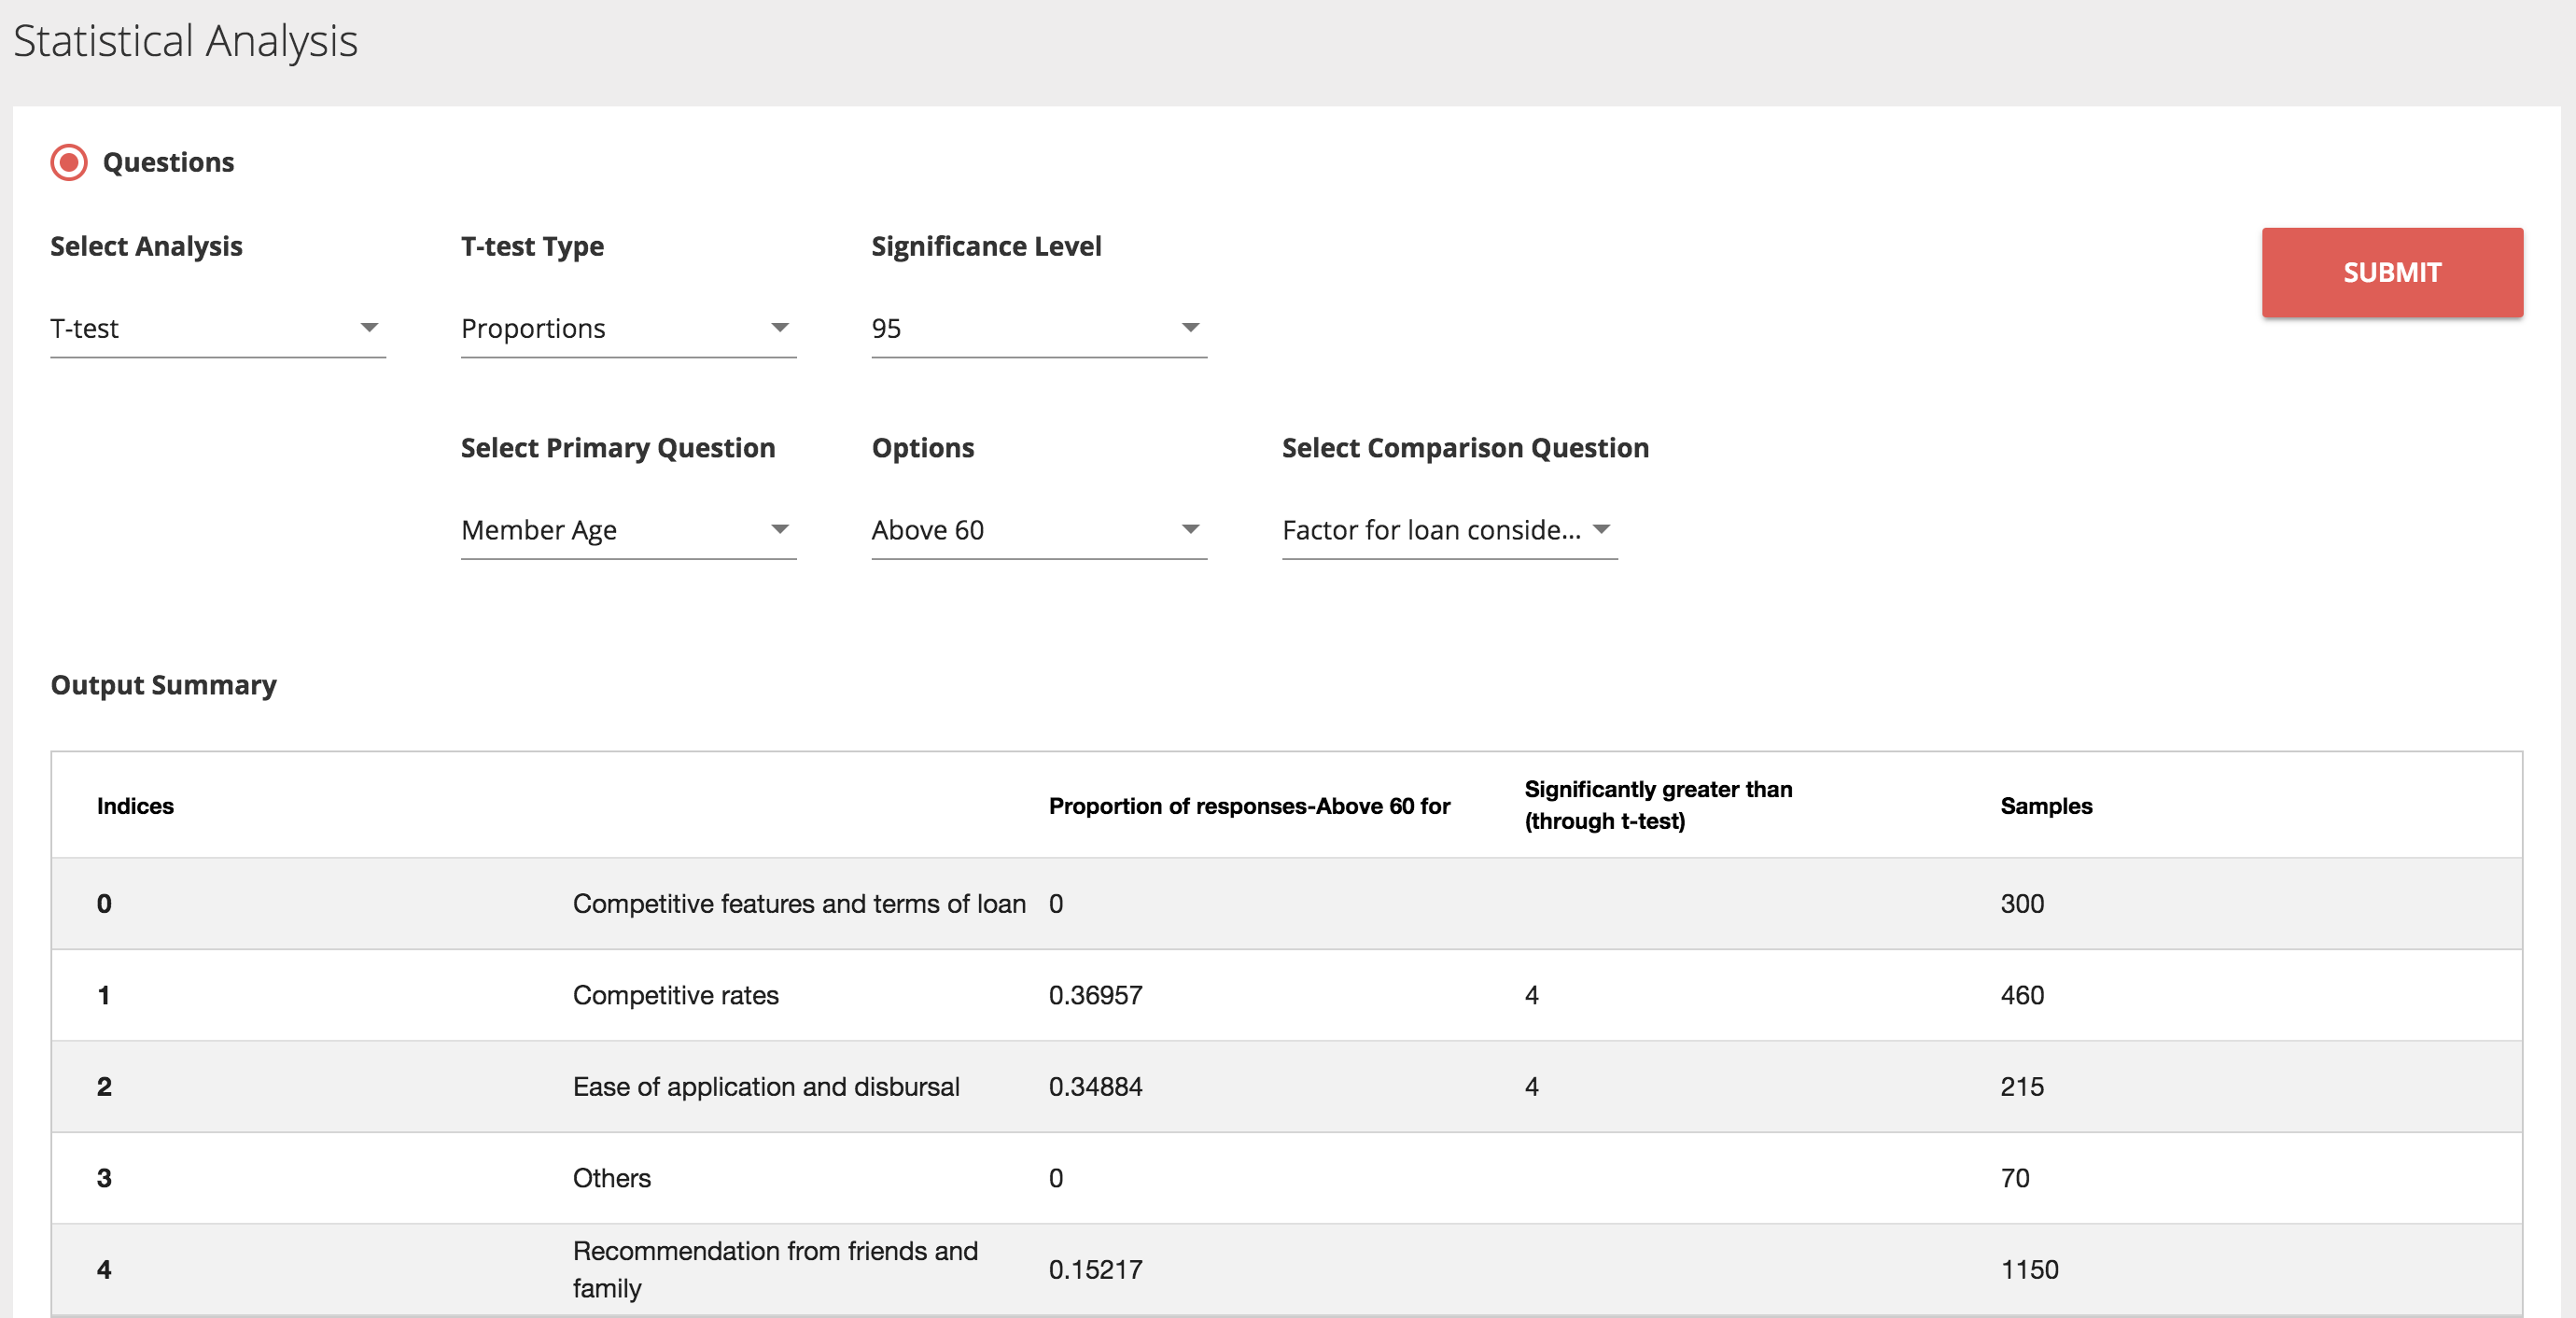
When is T-test used?
It is practically impossible for any business to reach out to 100% of their customers and have all of them respond to the surveys. Thus, any scores obtained through surveys are not precise but just a score for a sample of the population. But can organizations take key business decisions based on the data obtained from this sample? To answer this question, the data is tested for statistical significance.
The methods of inference used to support or reject claims based on sample data are known as tests of significance. If the data is statistically significant at 95% confidence level, it means that the margin of error in the data is at most 5%. Most commonly used confidence levels are 90%, 95% & 99%. Significance testing is used to establish the importance of the findings. If there is difference in performance between the customer groups, significance test is used to identify if this difference is important or just by chance.
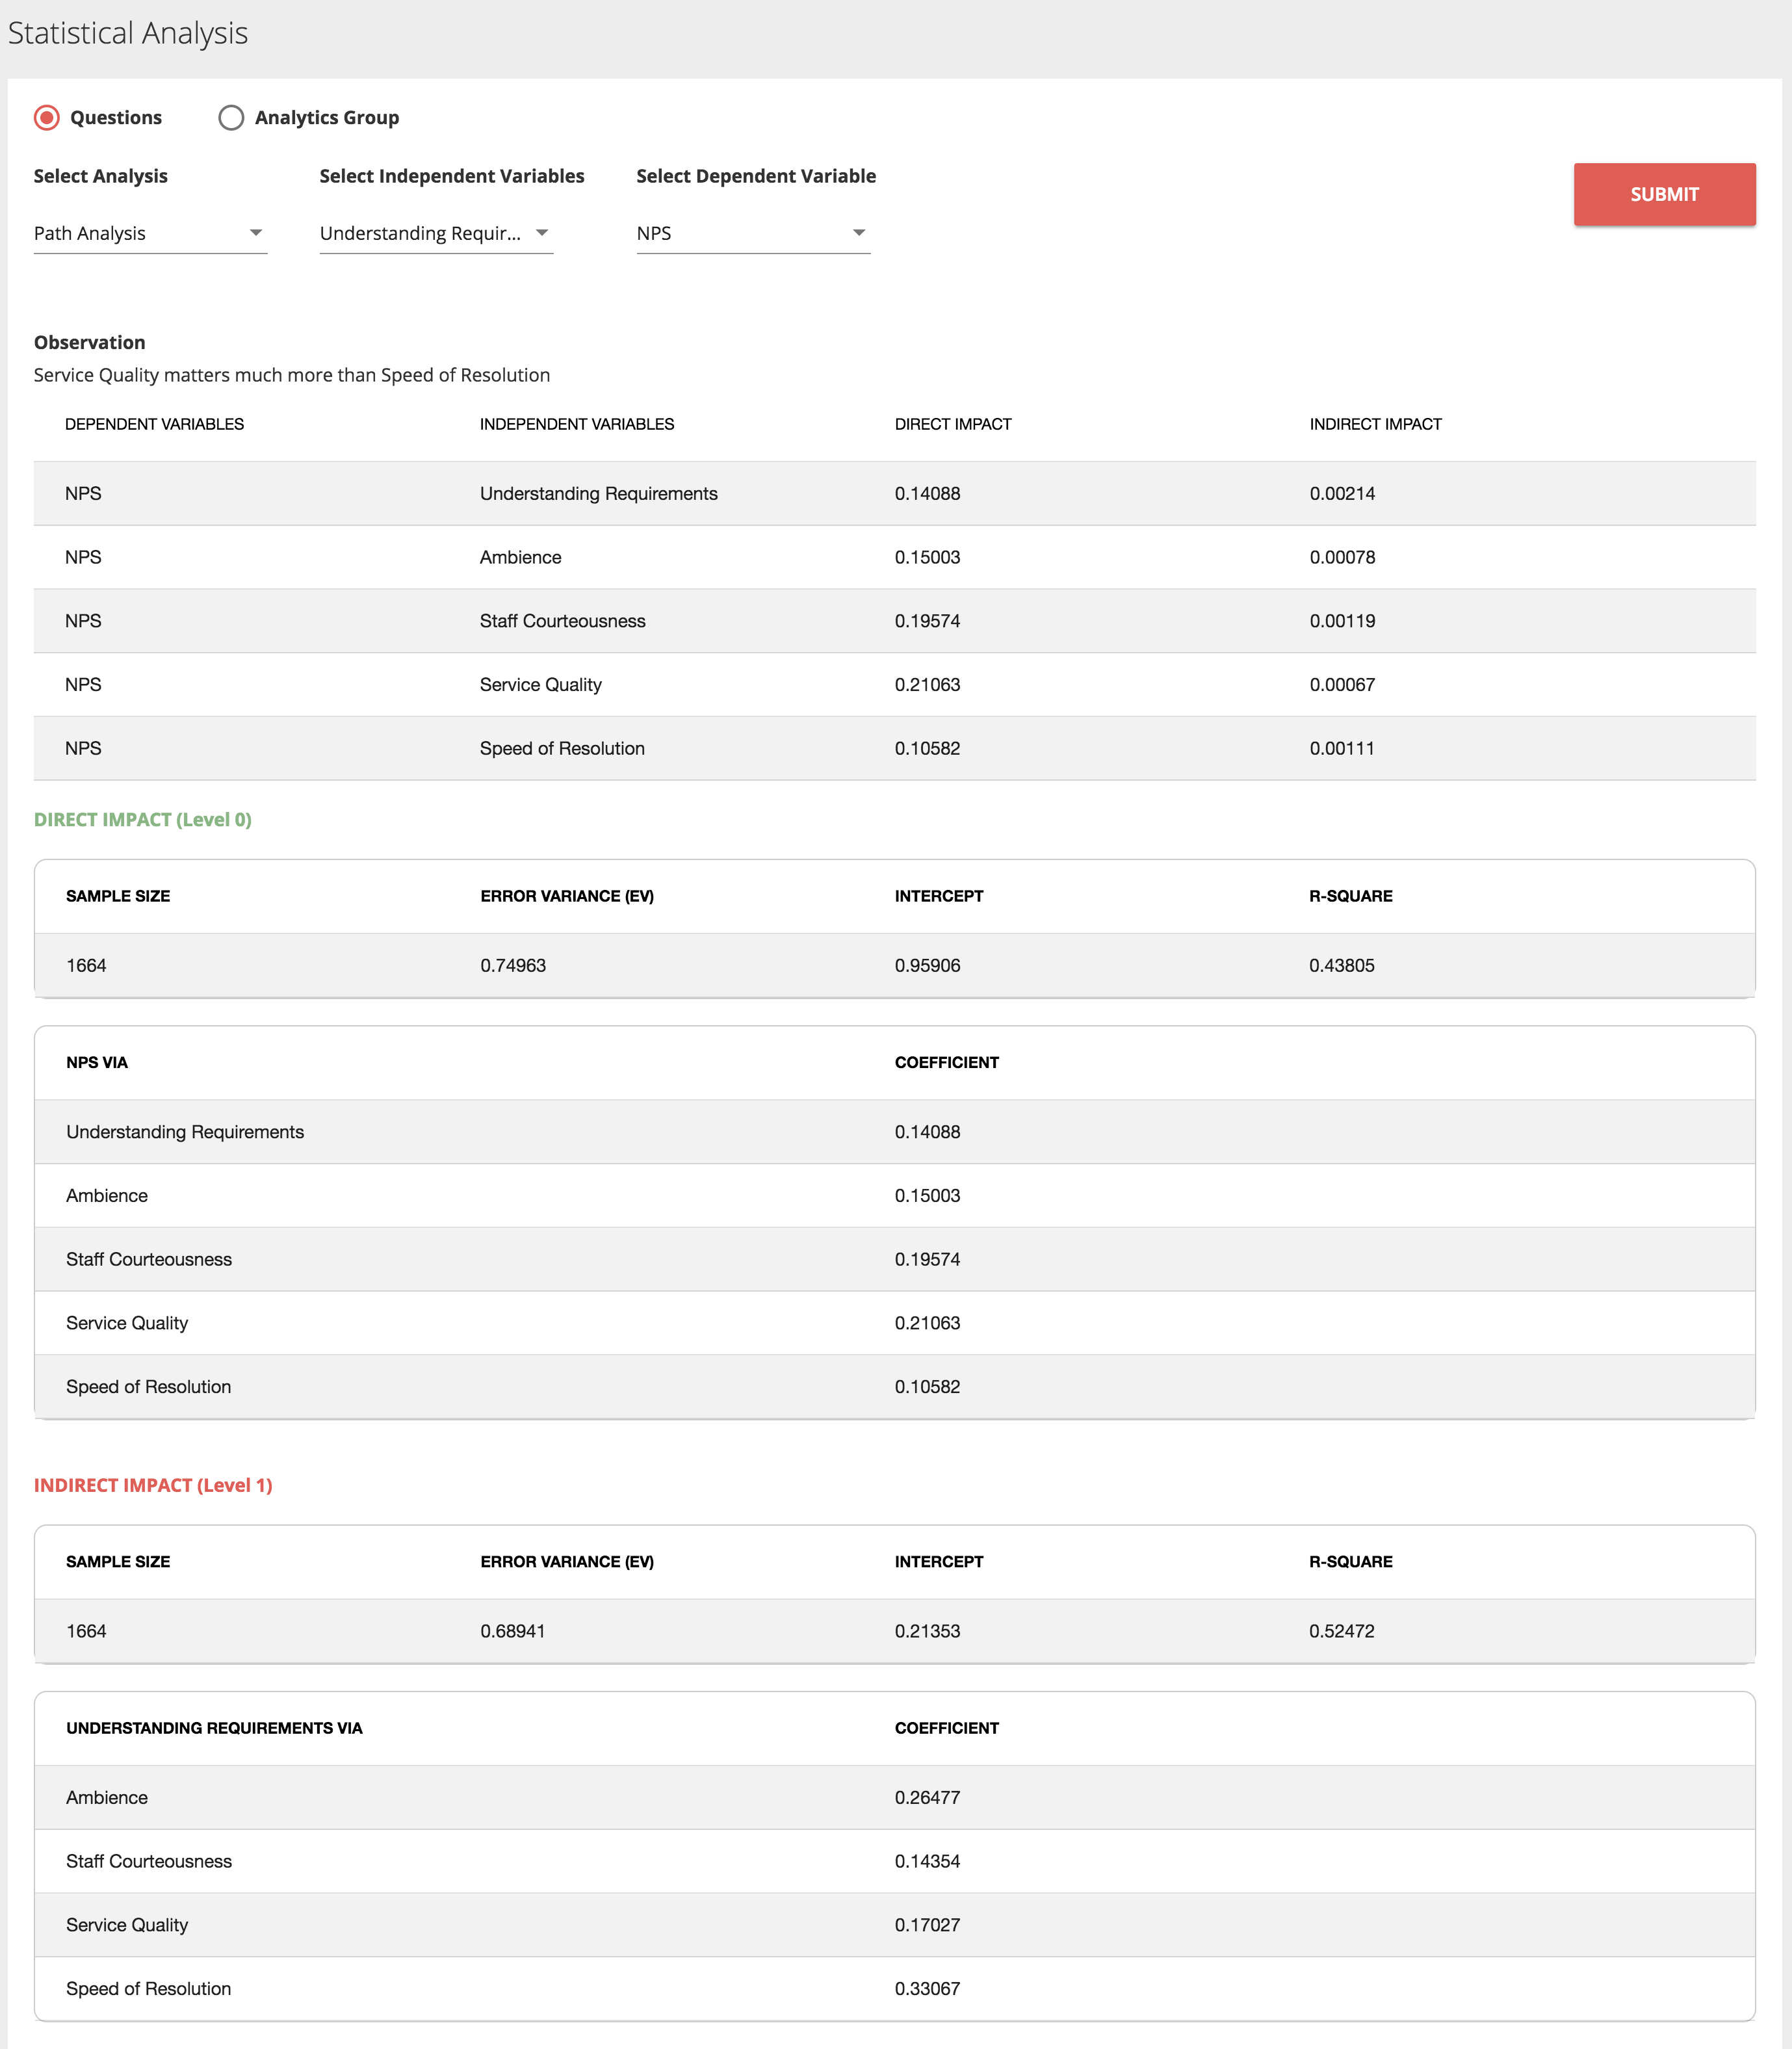
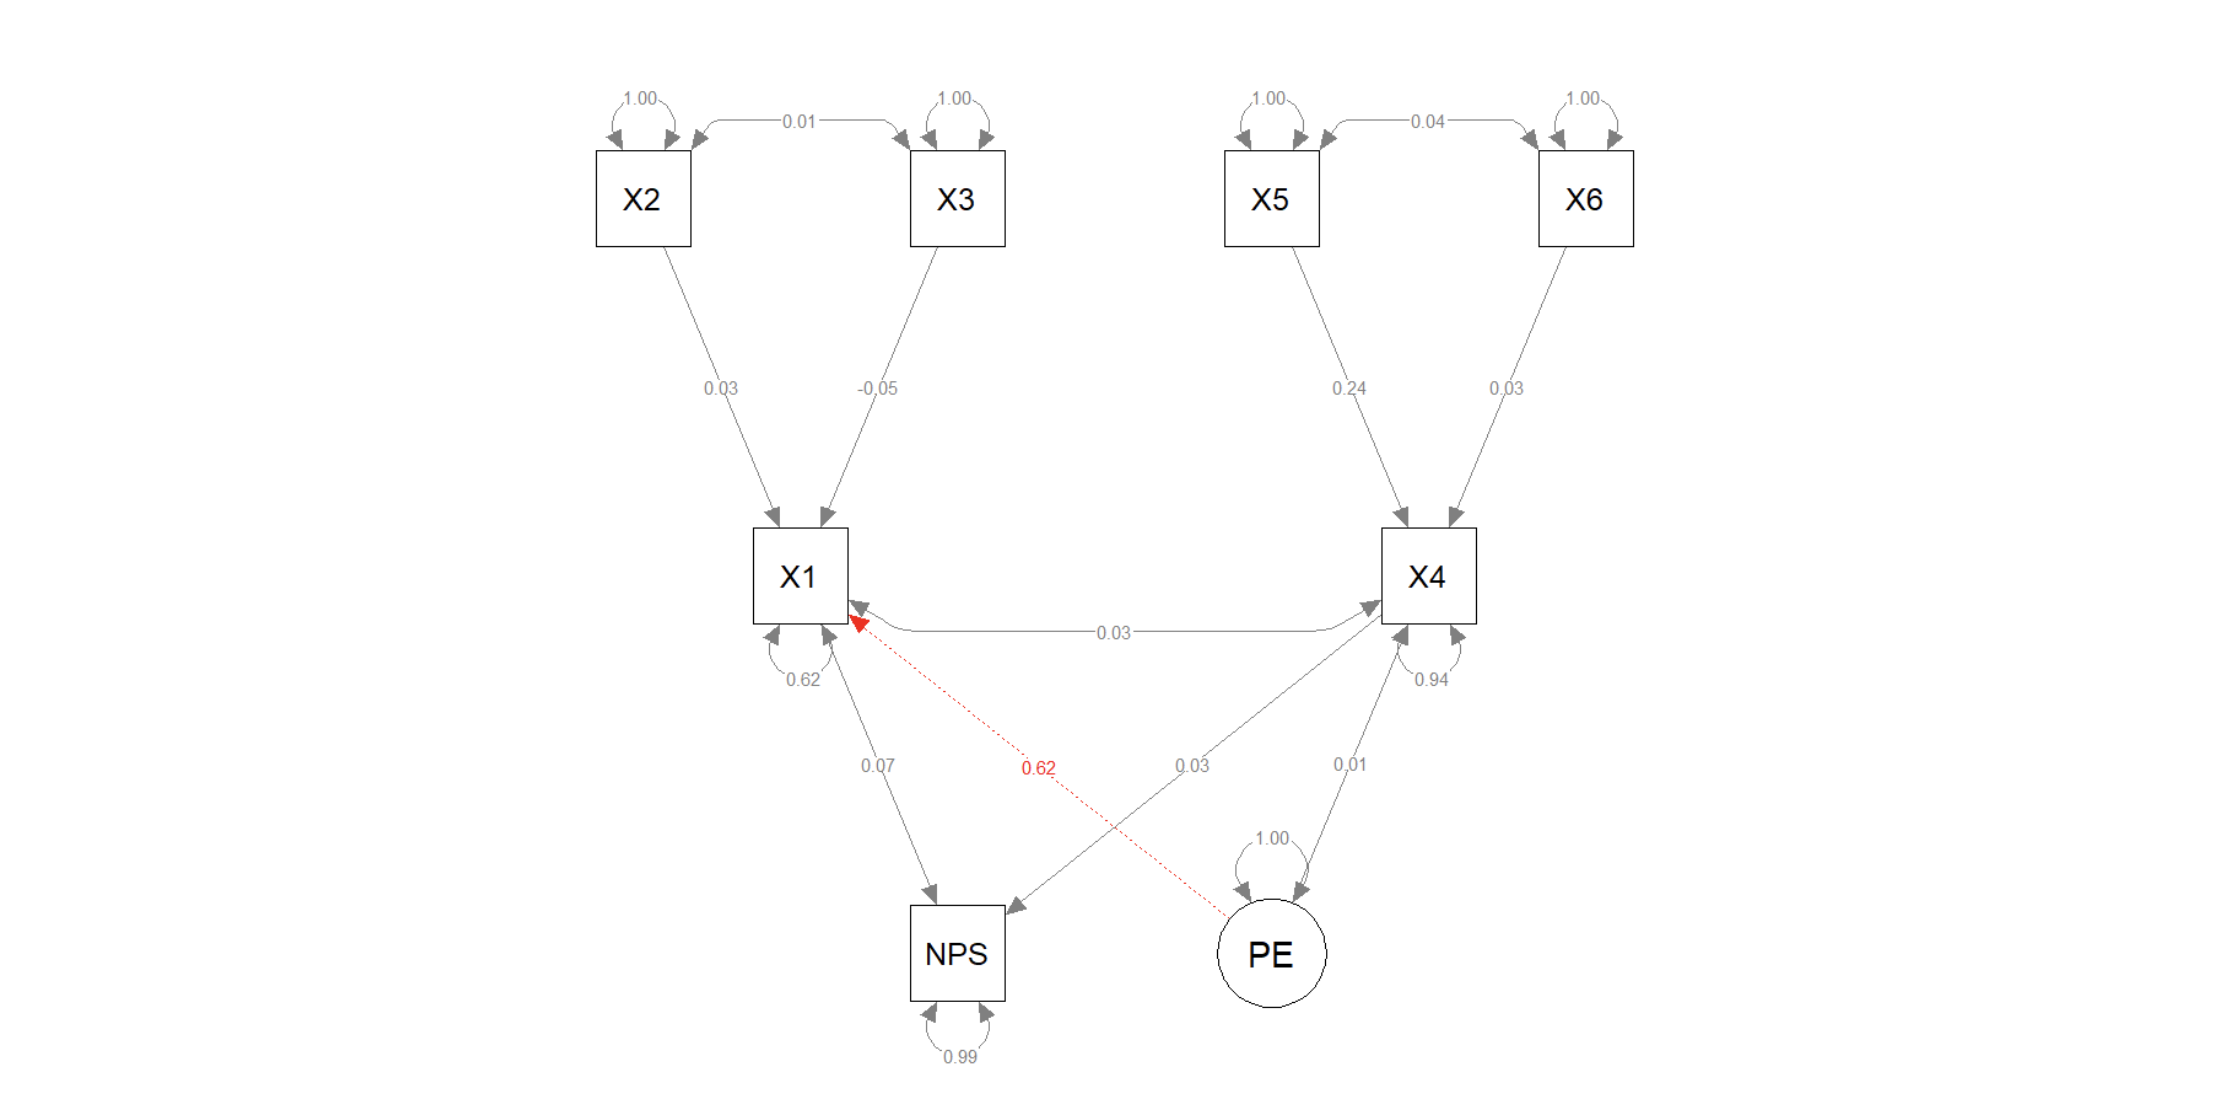
Path Analysis
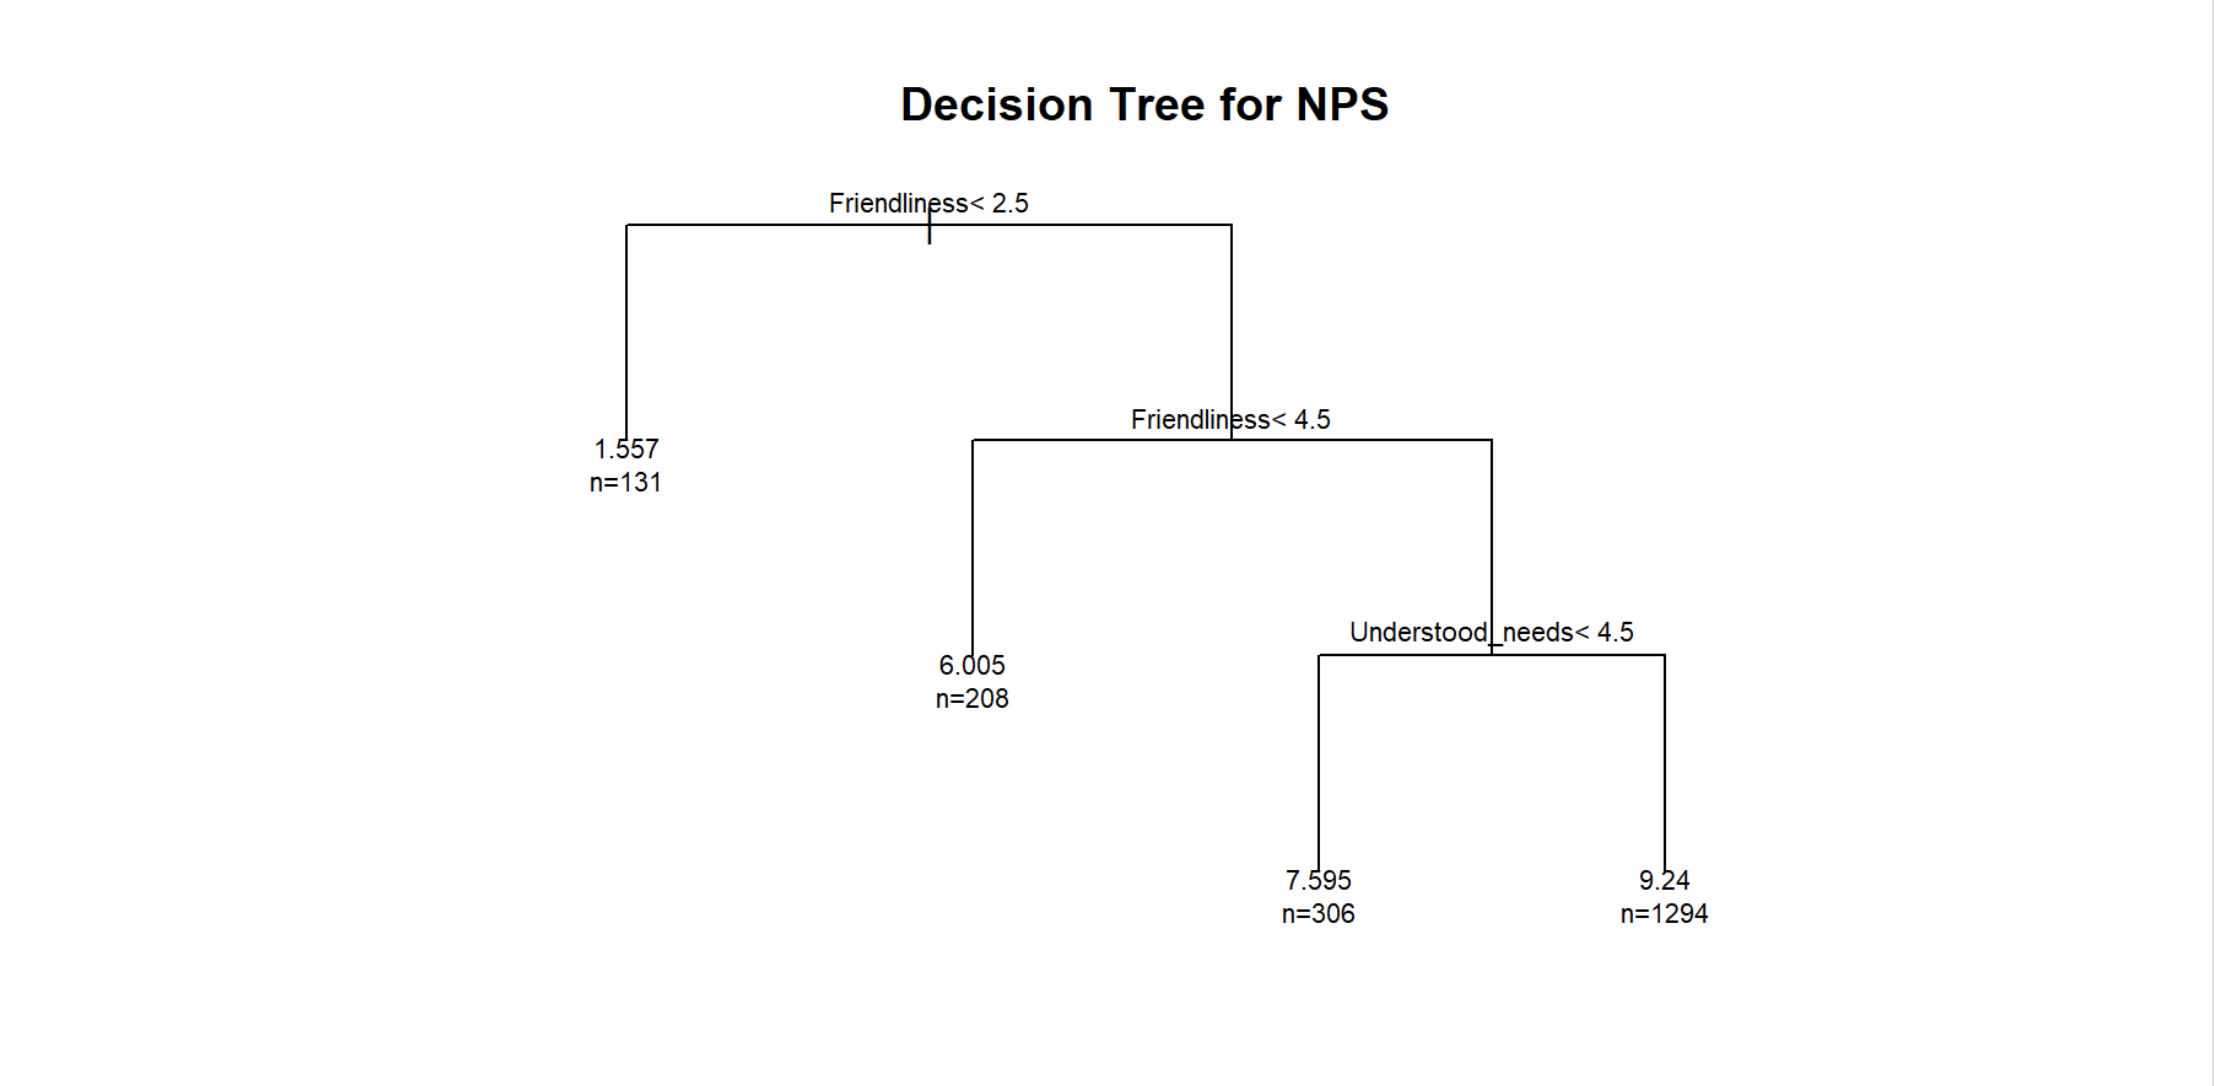
Decision Trees⁺
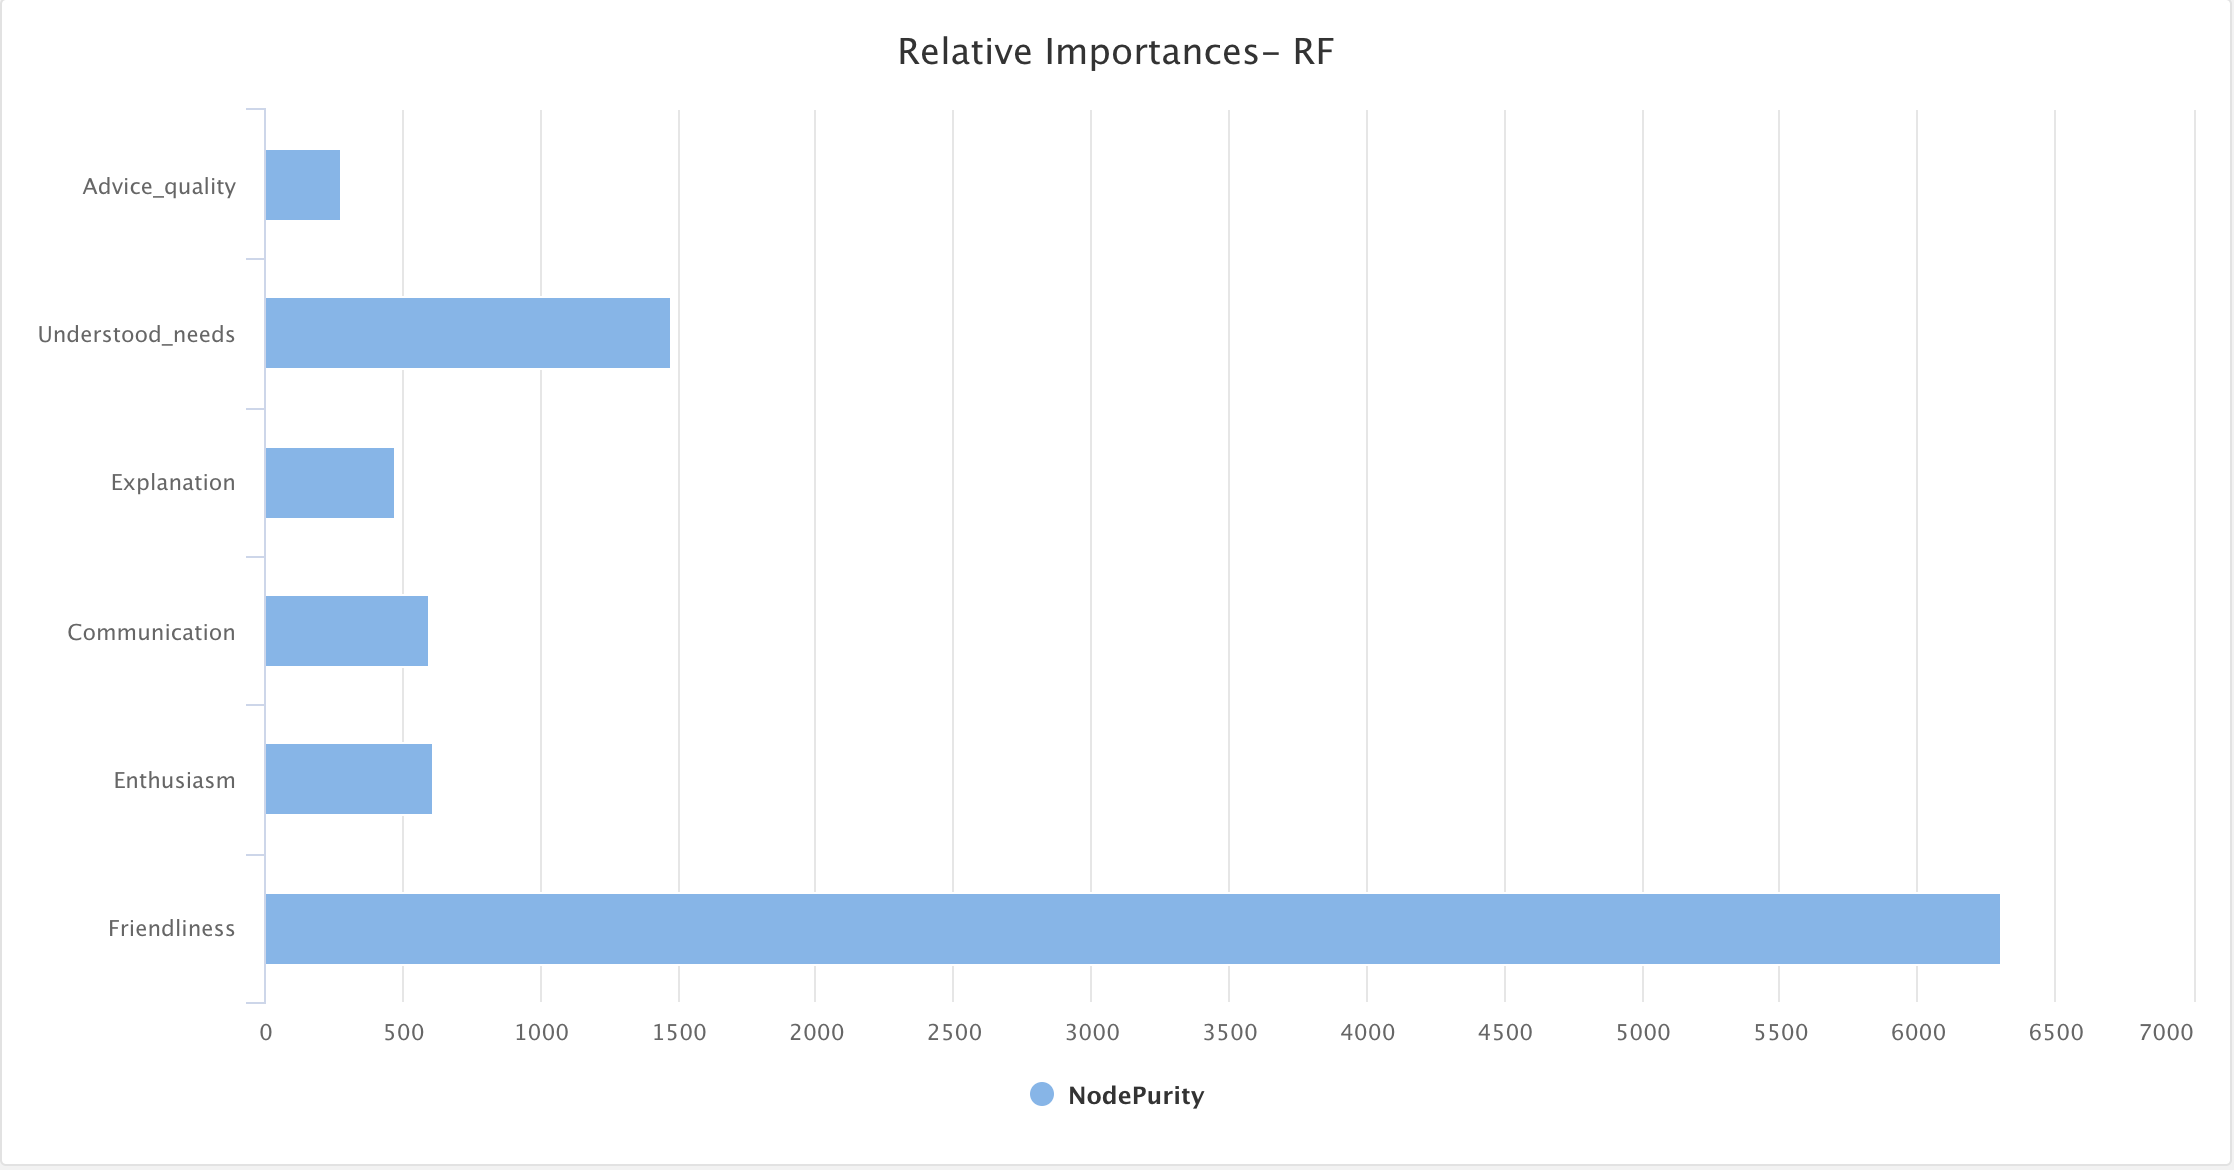
Random Forest⁺
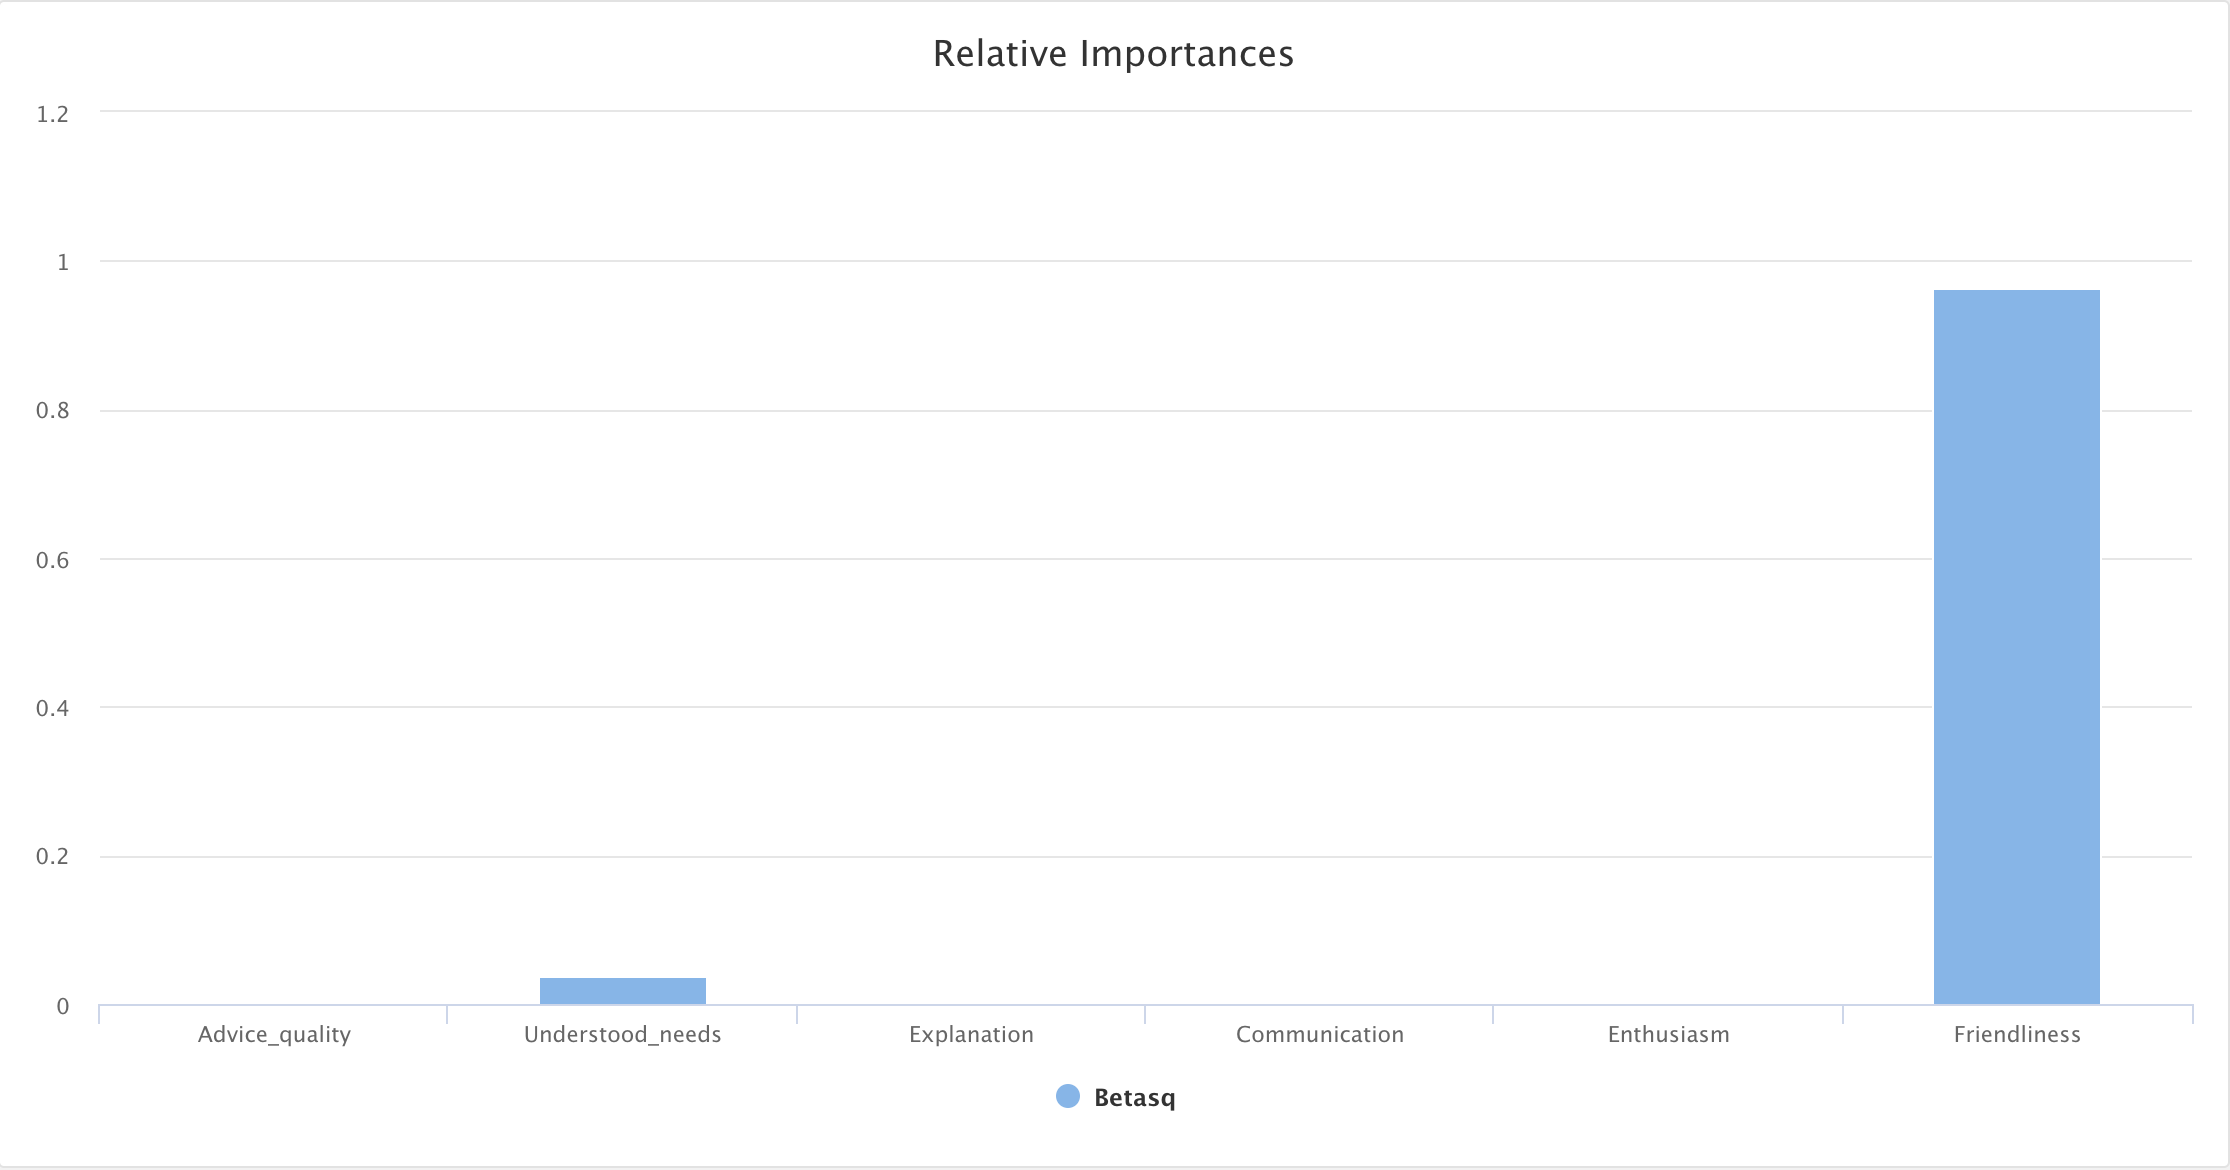
Betasq⁺
Structural Equation Modeling
K-Means Clustering⁺
Factor Analysis
Topic Modeling
Export to R
The Webex Experience Management R SDK lets you import Webex Experience Management data into R for the purpose of more extensive manipulation using the full range of libraries available in R.
Installing Webex Experience Management for R
The package is not yet on CRAN. To install the latest development version you can install from the Webex Experience Management Github repository. Just follow these steps in the R Console.
# latest version from Githubinstall.packages('devtools')
library(devtools)
install_github('cloudcherry-r-sdk','getcloudcherry')
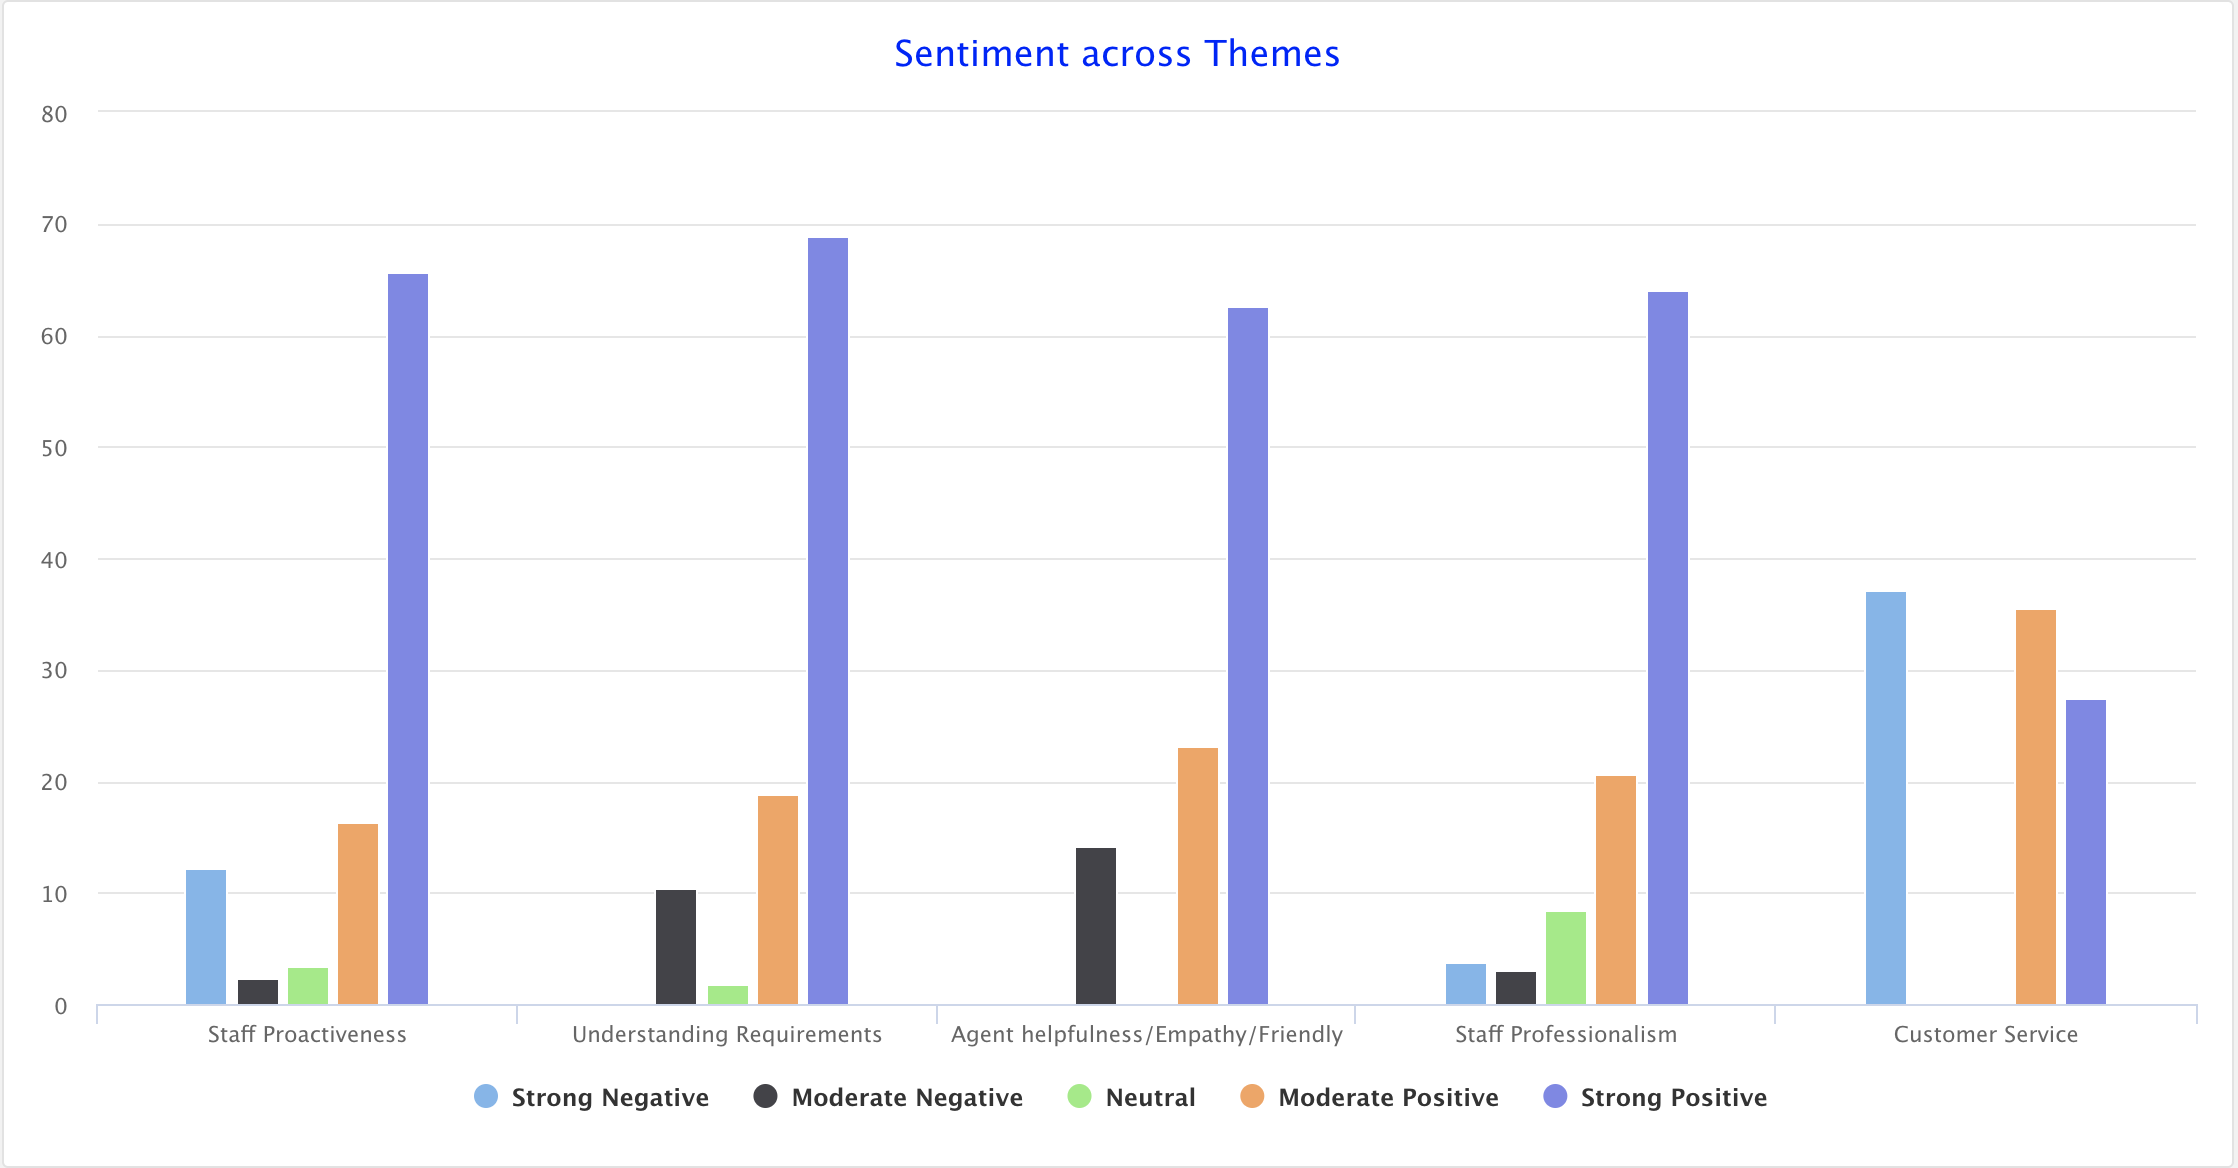
Example - Themes with Sentiment
Once imported, you can use the full range of R’s toolchain for further analysis. The sample below shows a simple example of manipulating sentiment scores and themes from Webex Experience Management’s text analytics to look at aggregates of sentiment across different themes.
Models developed in R by CX Analysts that are found valuable by business users are candidates for addition to Webex Experience Management’s statistical framework for general availability over standard API.
Custom Reports
Leverage our ready integration with R Studio to create entirely custom reports for your organization with full flexibility for branding, layouts, visualization and export preferences.
These reports can be automatically updated by synchronization with Webex Experience Management over secure APIs.